
Home Lab for Live Attack Demonstrations in SIEM (Microsoft Sentinel)
Project information
- Title: Azure Sentinel Home Lab
- Organizer: Self
- Project date: July, 2023
- URL: ajithchandranr.github.io
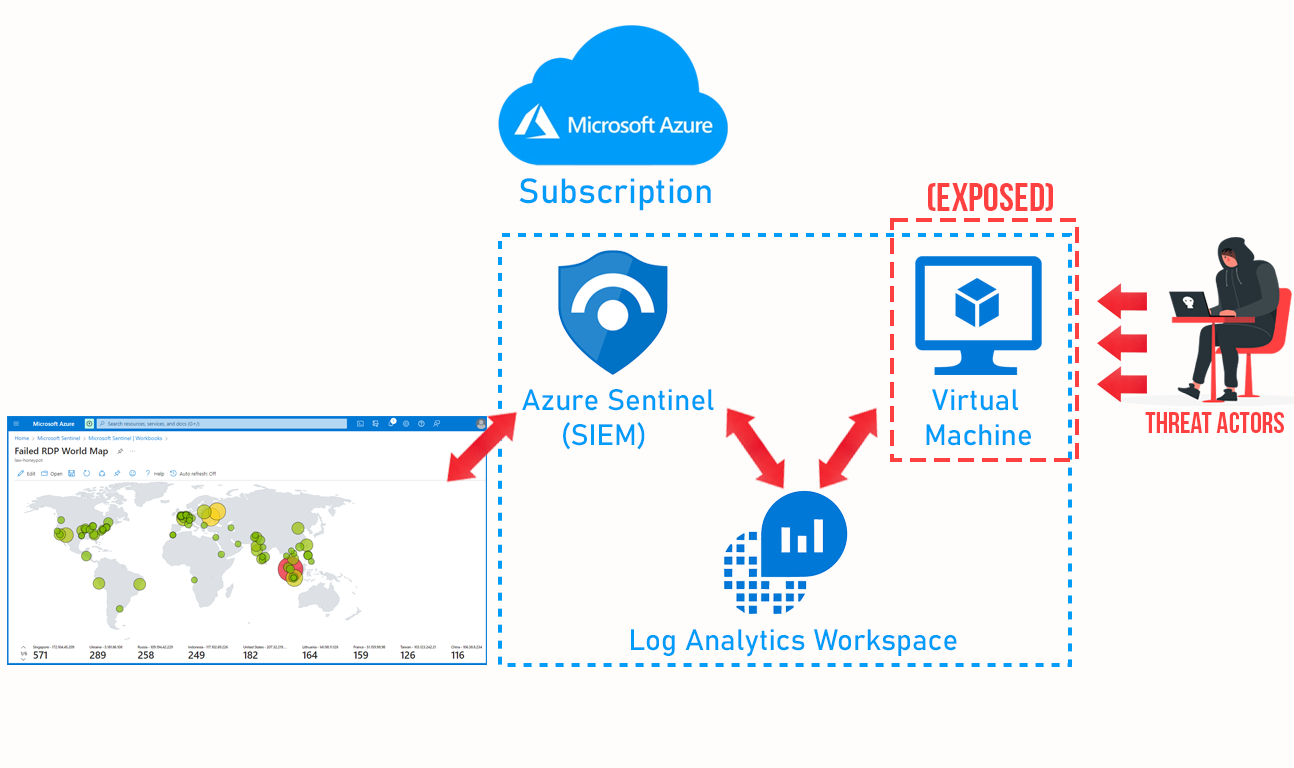
I would like to share my experience of using "Microsoft Azure" to create a virtual machine (VM) running Windows 10 in the cloud. The main objective of this project was to demonstrate the integration of different tools and resources, such as "Azure Log Analytics Workspace", Microsoft Defender for Cloud, and Azure Sentinel.
To start, I utilized PowerShell to scan the Event Viewer within the VM and specifically focused on "EventID 4625", which indicates failed logon attempts. I then captured this data and saved it in a log file. Additionally, I employed a PowerShell script to interact with the www.abstractapi.com API, enabling me to retrieve IP addresses associated with these failed logon attempts. By utilizing these tools, I successfully collected and consolidated attack data, which I subsequently visualized on a map within "Microsoft Sentinel". This visualization allowed me to trace the origins of these logon attempts.
Without any additional delay, let's begin.
. . .
In this project, various tools and utilities were utilized, including "Microsoft Sentinel (SIEM), Log Analytic Workbooks, Microsoft Defender for Cloud, Virtual Machines, Remote Desktop, PowerShell, APIs, Event Viewer, and Firewalls". These resources were deployed in the "Microsoft Azure" cloud environment, with
"Windows 10(22H2)" as the operating system.
Helpful Links:
-
Microsoft Azure Free Trial: https://azure.microsoft.com/en-us/free/
-
Geolocation API: https://www.abstractapi.com
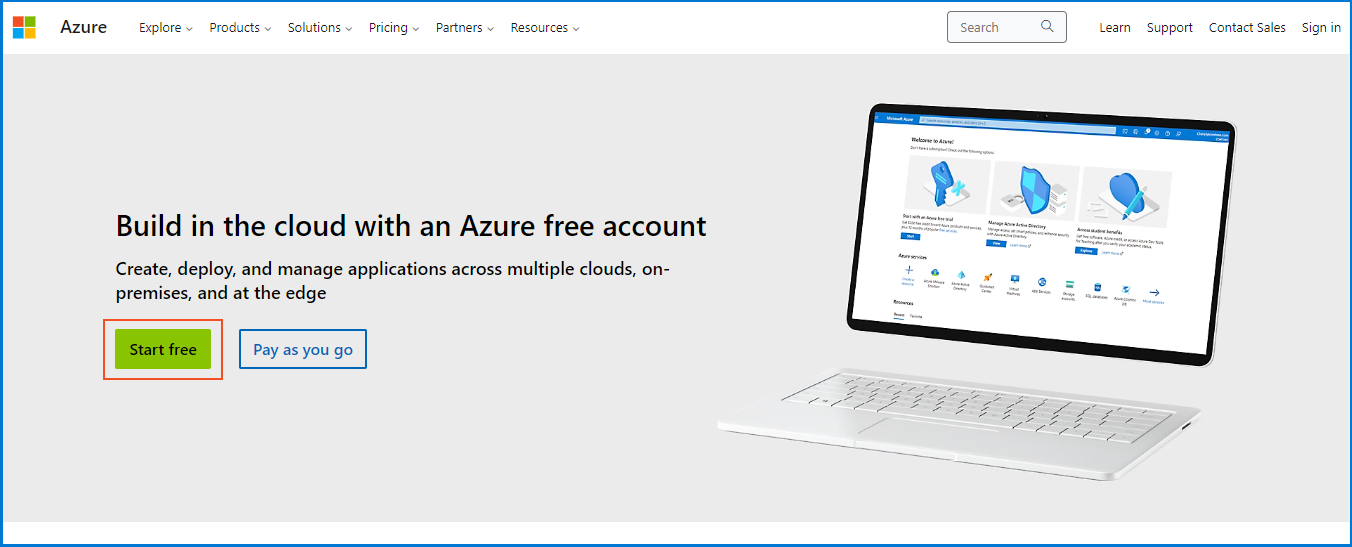
To get started, head over to the "Microsoft Azure" website and create a new account by clicking on the "Start Free" button. Complete the setup process, and once finished, you will be directed to the "Microsoft Azure" home page.
Upon signing up, Microsoft will grant you a $200 credit that remains valid for one month. Given that the resource requirements for this project are not particularly demanding, you can utilize the credit for future projects.
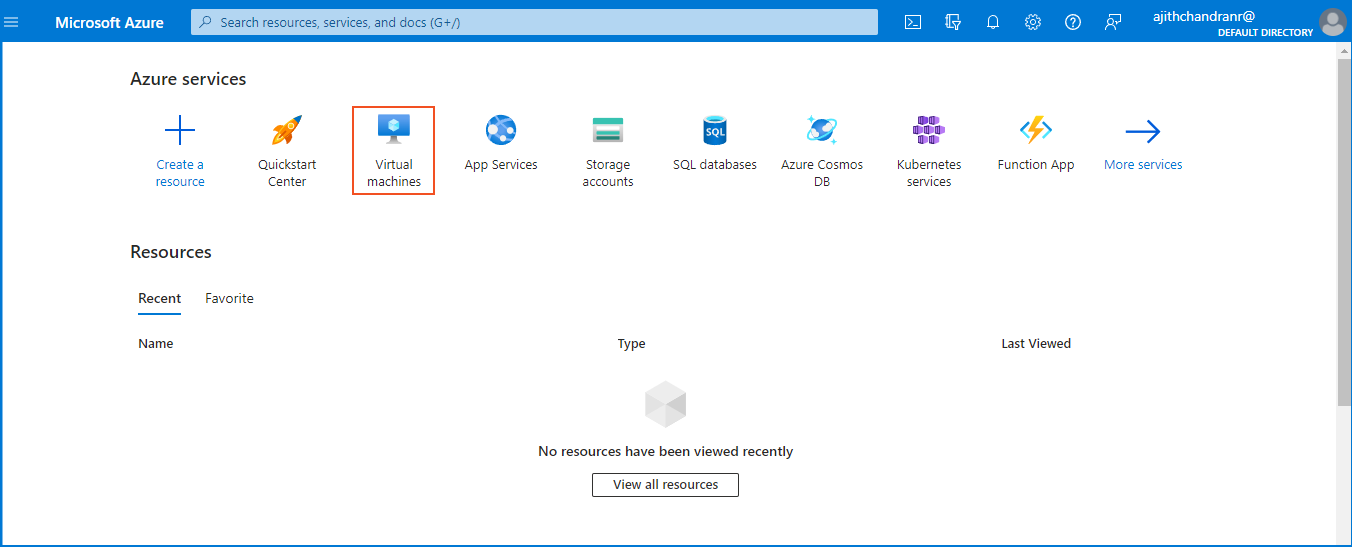
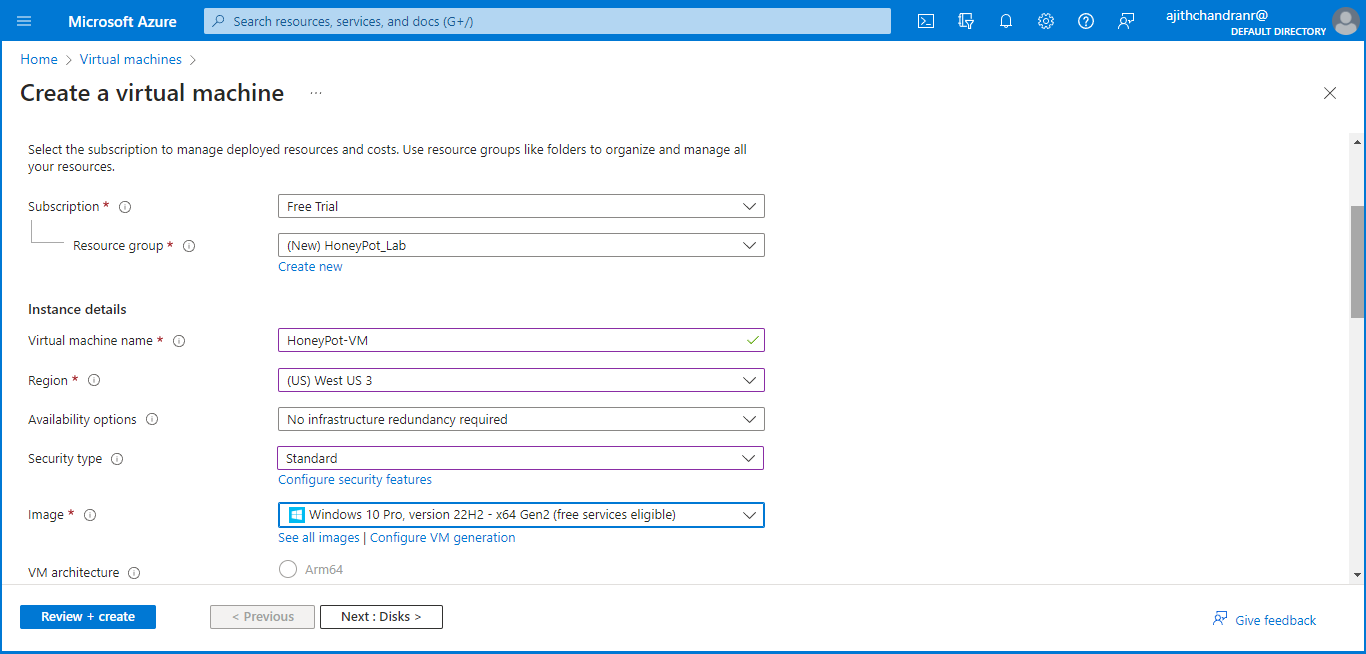
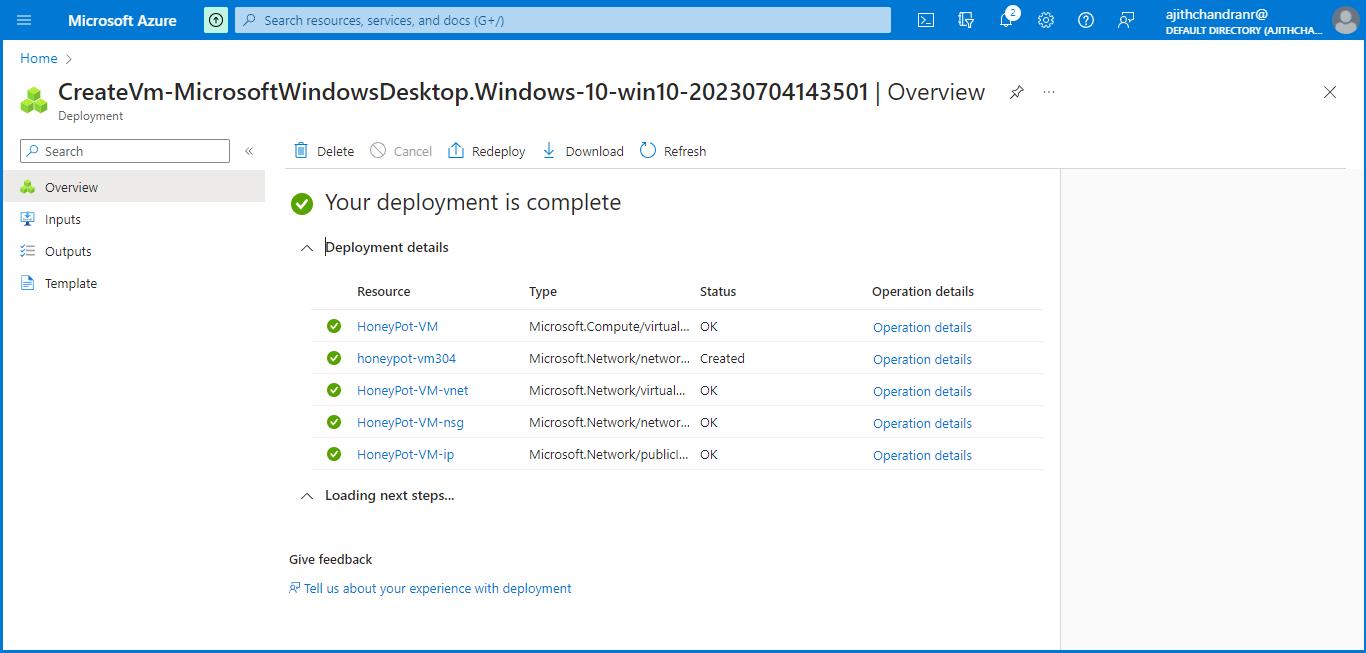
Next, navigate to the top menu and select "Virtual Machine" to create a publicly accessible VM, acting as a honeypot to attract potential attackers. Concurrently, establish a new Resource Group to streamline resource management and enable effortless creation, deletion, and organization of resources within a unified framework.
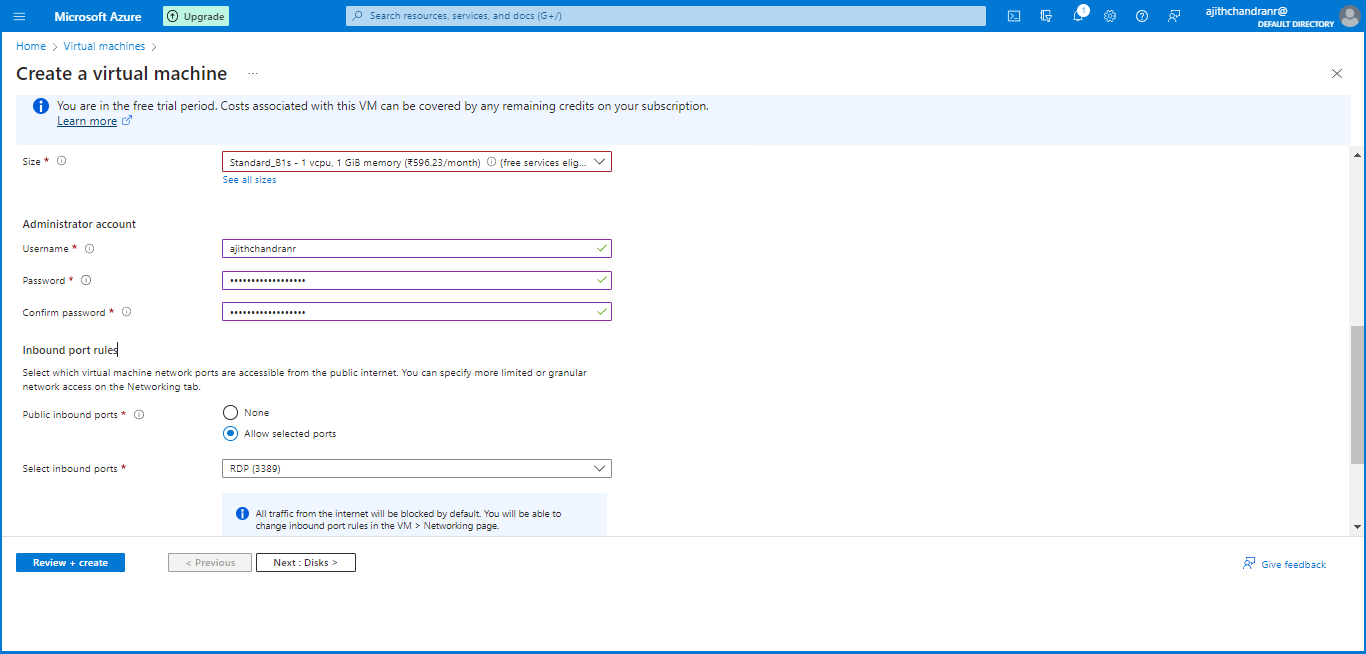
I have designated the resource group as "HoneyPot_Lab" and named the virtual machine as "HoneyPot-VM". Furthermore, I have opted for the "(US) West US 3" region, selected the "Standard" security type, and chosen "Windows 10 Pro, Version 22H2" as the operating system.
As I continued scrolling down on the same page, I decided to choose the VM size and initially selected "Standard_B1s". However, later on, I upgraded to
"Standard B2s" for an improved user experience. I choose a unique admin name and a strong password with a mix of special characters, numbers, and lowercase and uppercase letters. For the public inbound port rules, I decide to allow only "RDP (port 3389)"" for connecting to the VM,
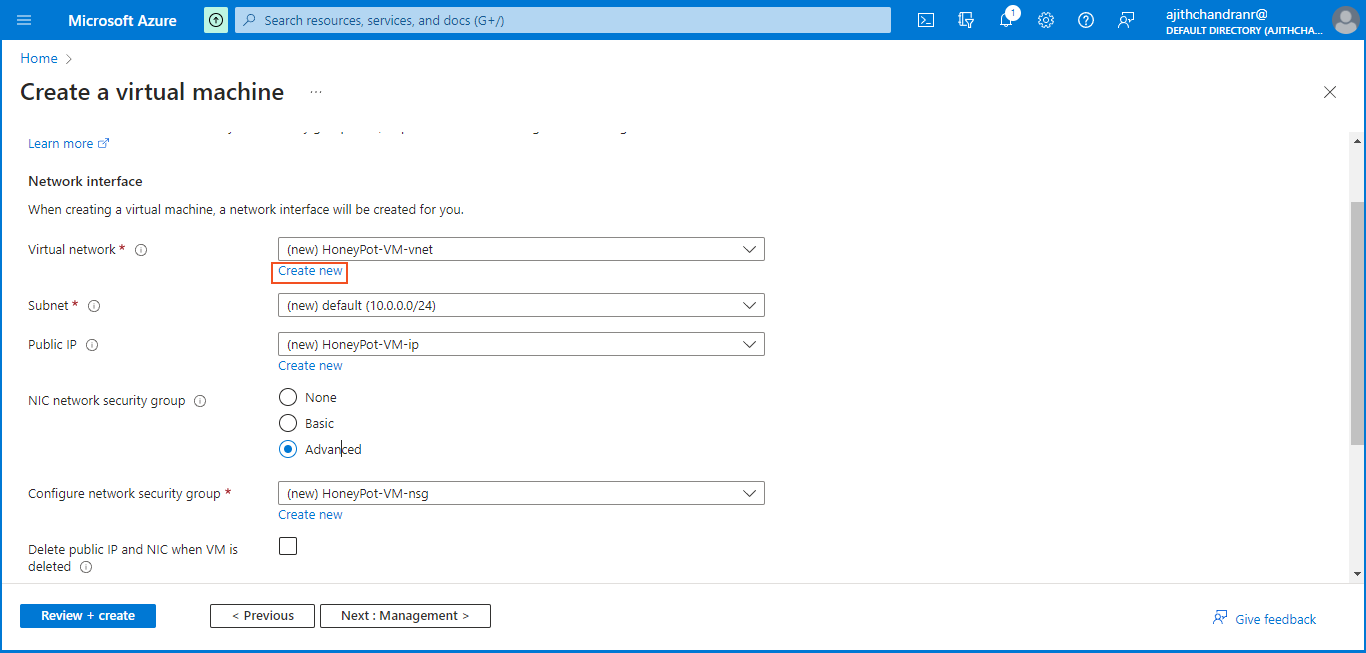
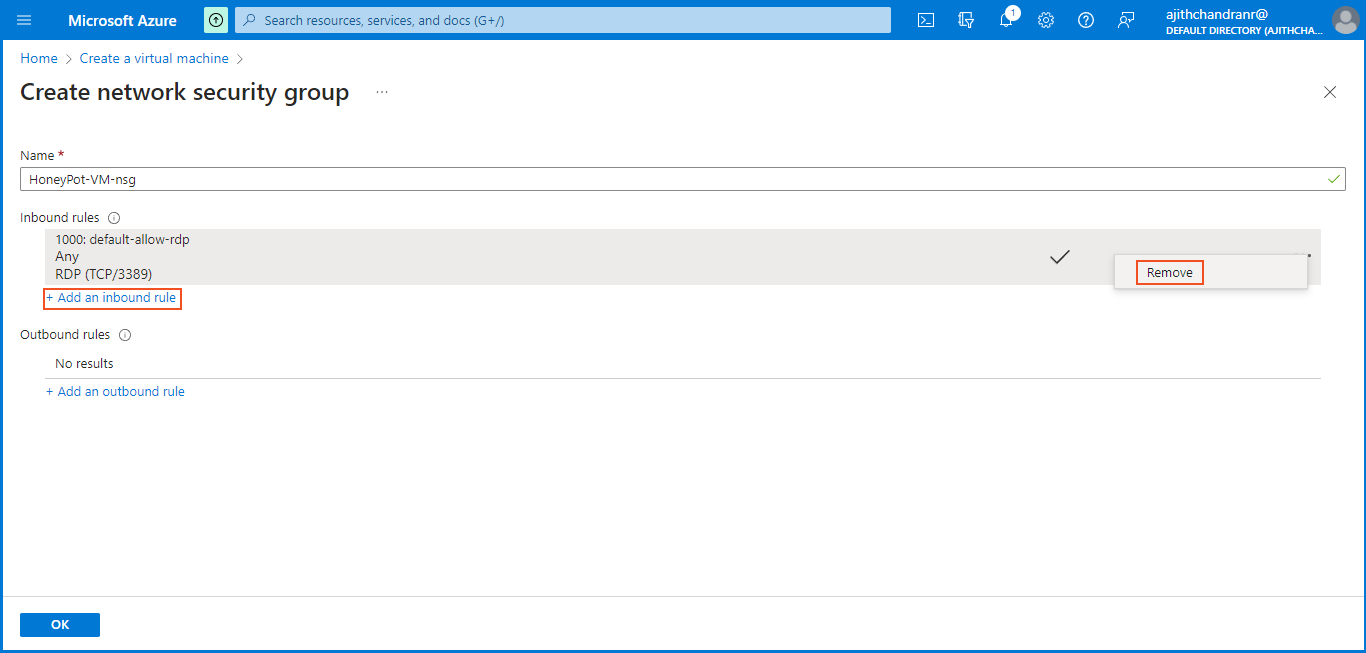
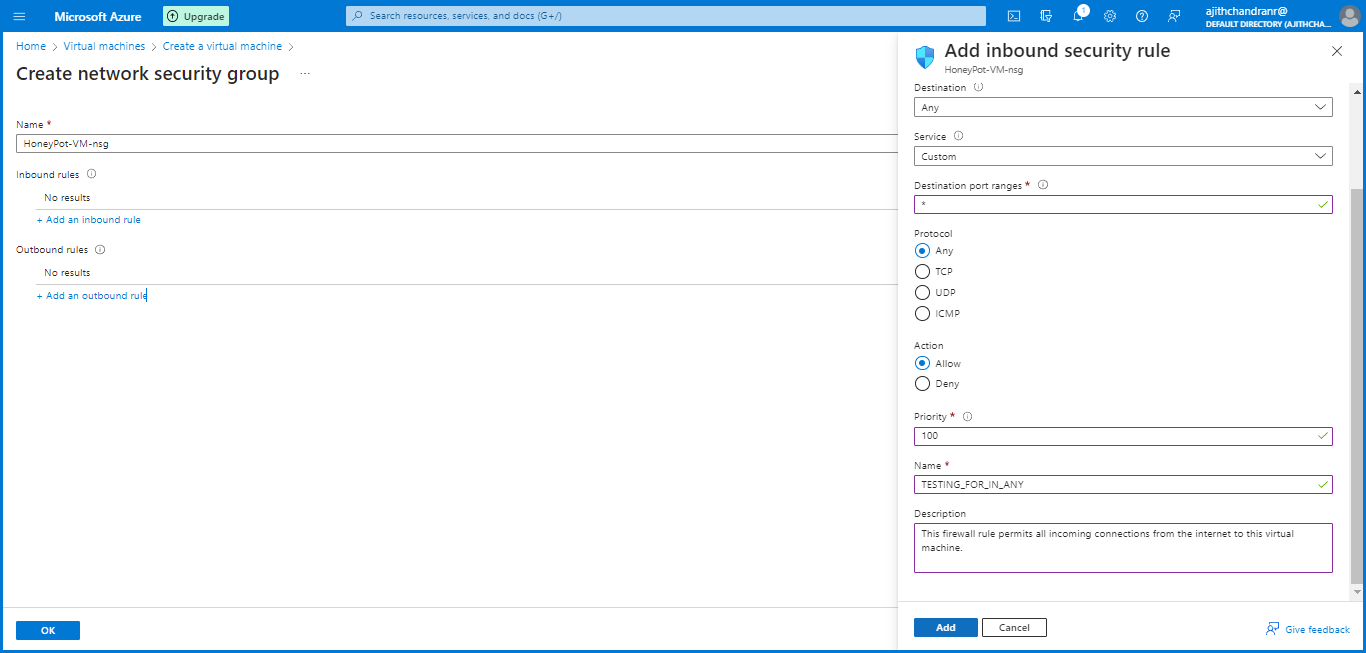
Next, we need to create a new "Network Security Group (NSG)" to serve as a firewall for the honeypot VM. In this project, our goal is to allow unrestricted communication with the VM by removing the default inbound rule and replacing it with a new rule that permits ALL traffic.
To achieve this, we set an asterisk (*) in the Destination Port Ranges field, enabling communication on any port ranges. Additionally, we have allowed any protocol for flexibility. The Priority has been set to 100, giving this rule higher priority over others in case of conflicting rules.
It's crucial to note that this configuration is intended for demonstration purposes only and should never be implemented in a real production environment.
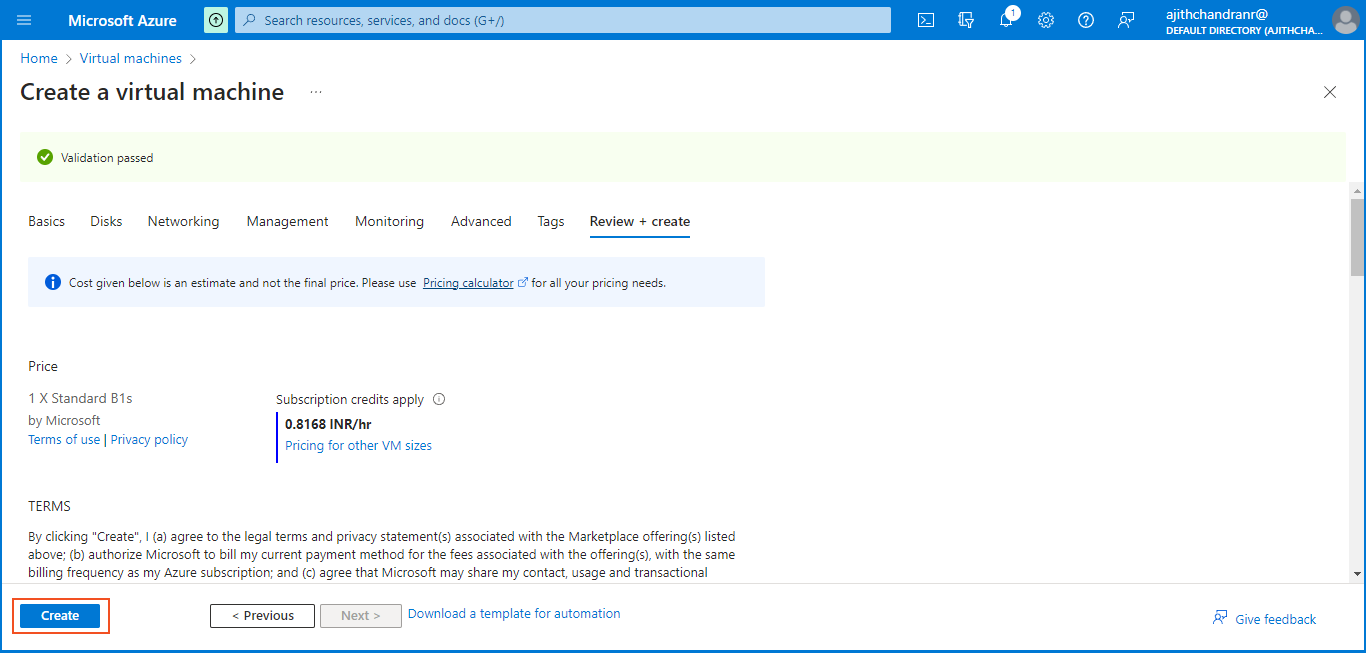
Moving ahead, I navigated to the "Review + Create" section. After verifying the settings and configurations, I clicked on "Create" to deploy the virtual machine (VM).
I will create a Log Analytics Workspace to ingest logs from the virtual machine, including "Windows event logs", and generate a custom log with geographic information. This helps to identify potential attackers' origins. "Azure Sentinel", the SIEM tool, will connect to this workspace to display the geodata on a map for visualization and analysis.
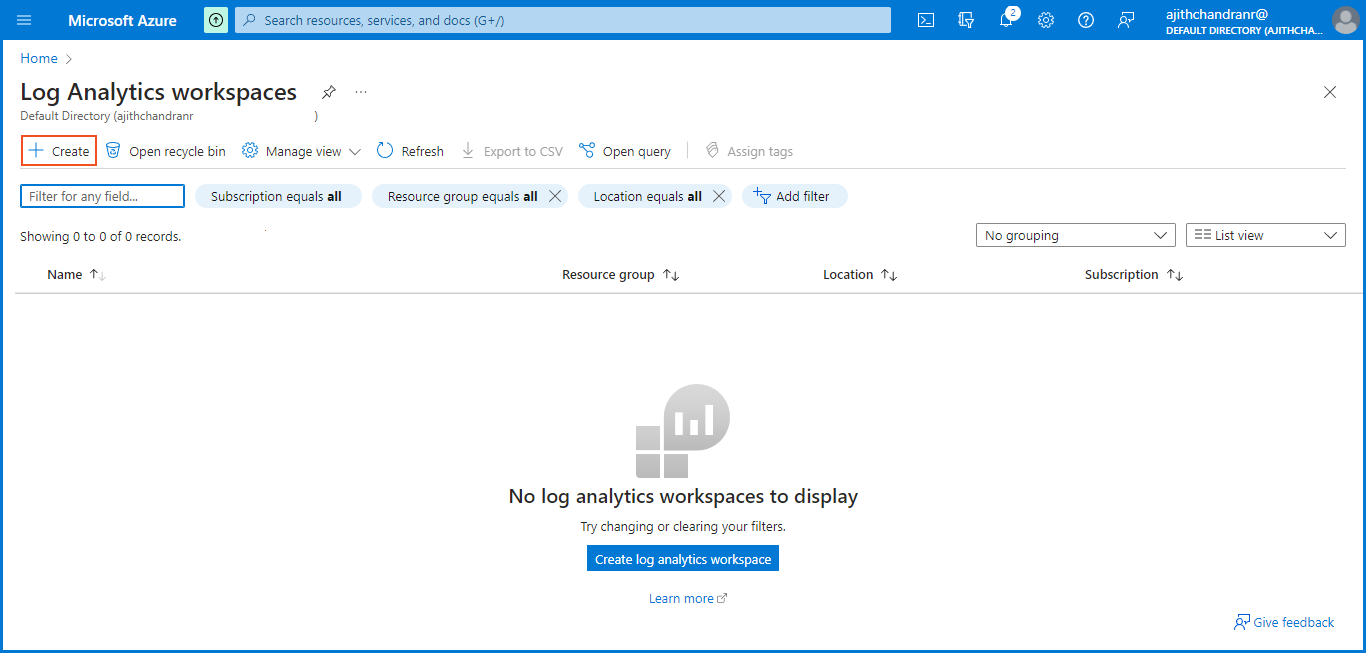
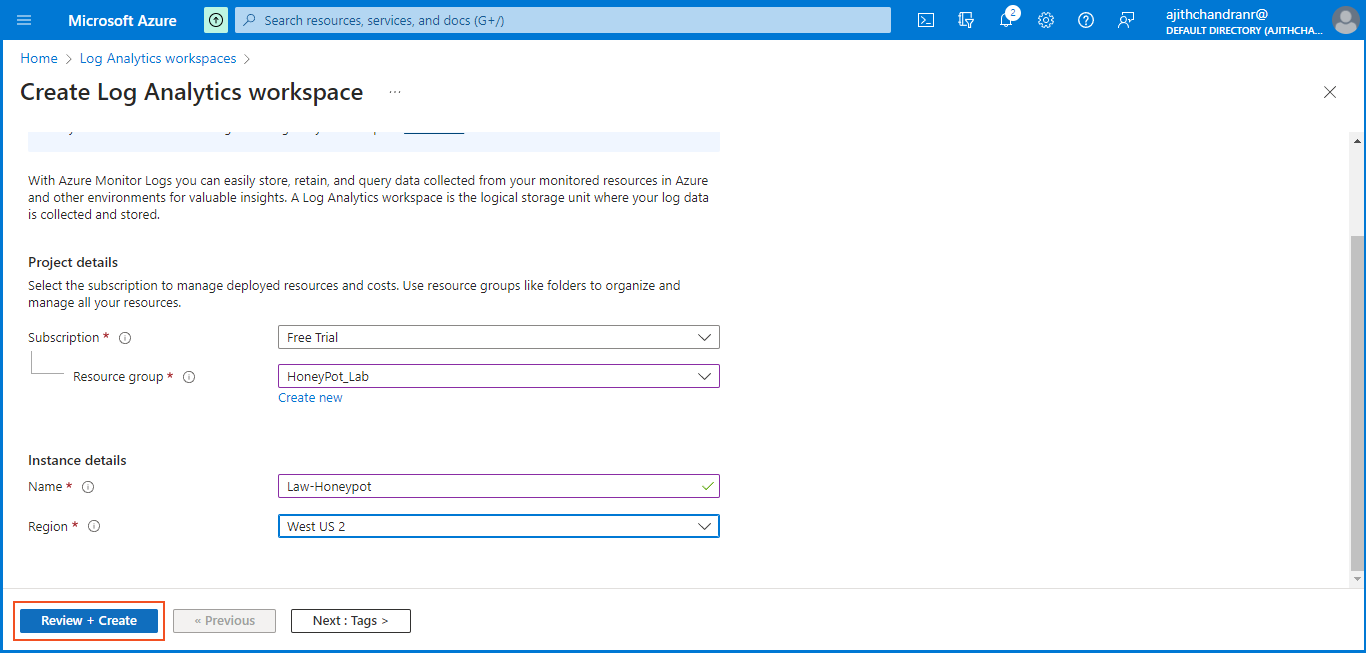
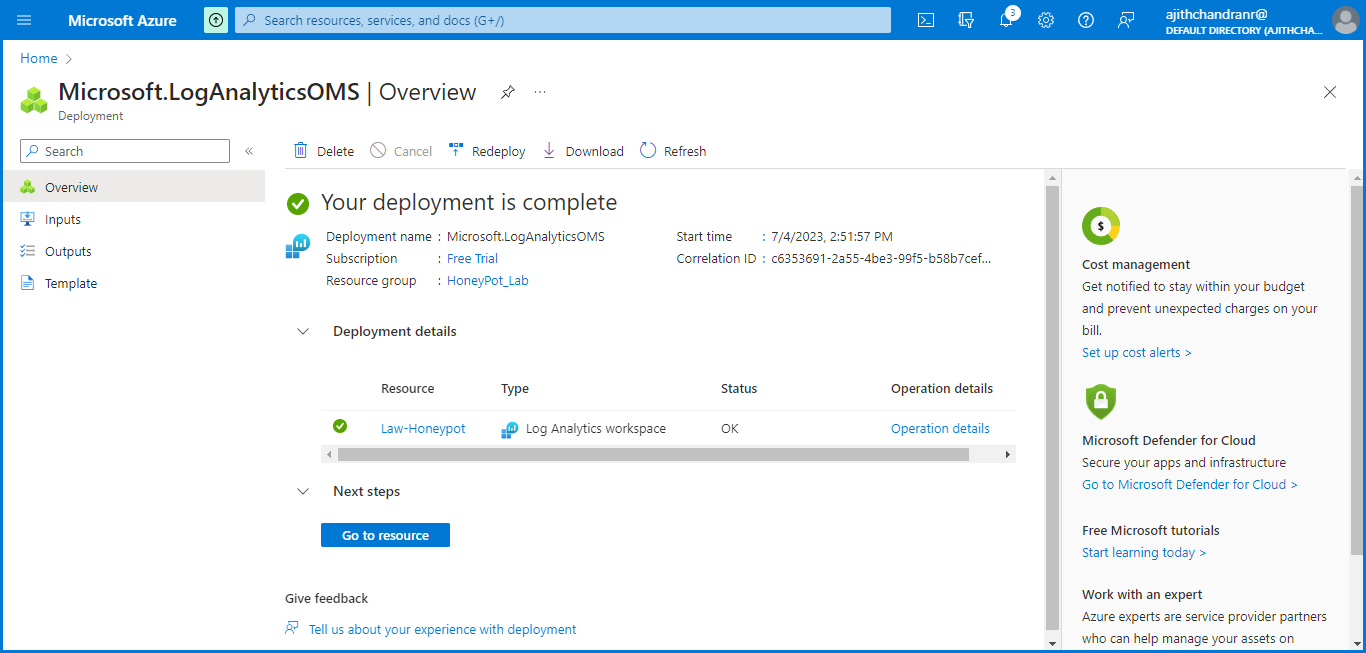
To create a Log Analytics Workspace, you can locate it on the Azure home dashboard or by searching for it using the search bar. After selecting "Create", I chose "HoneyPot_Lab" as the resource group and named the instance
"Law-Honeypot". Finally, I clicked on "Create" to successfully deploy the workspace.
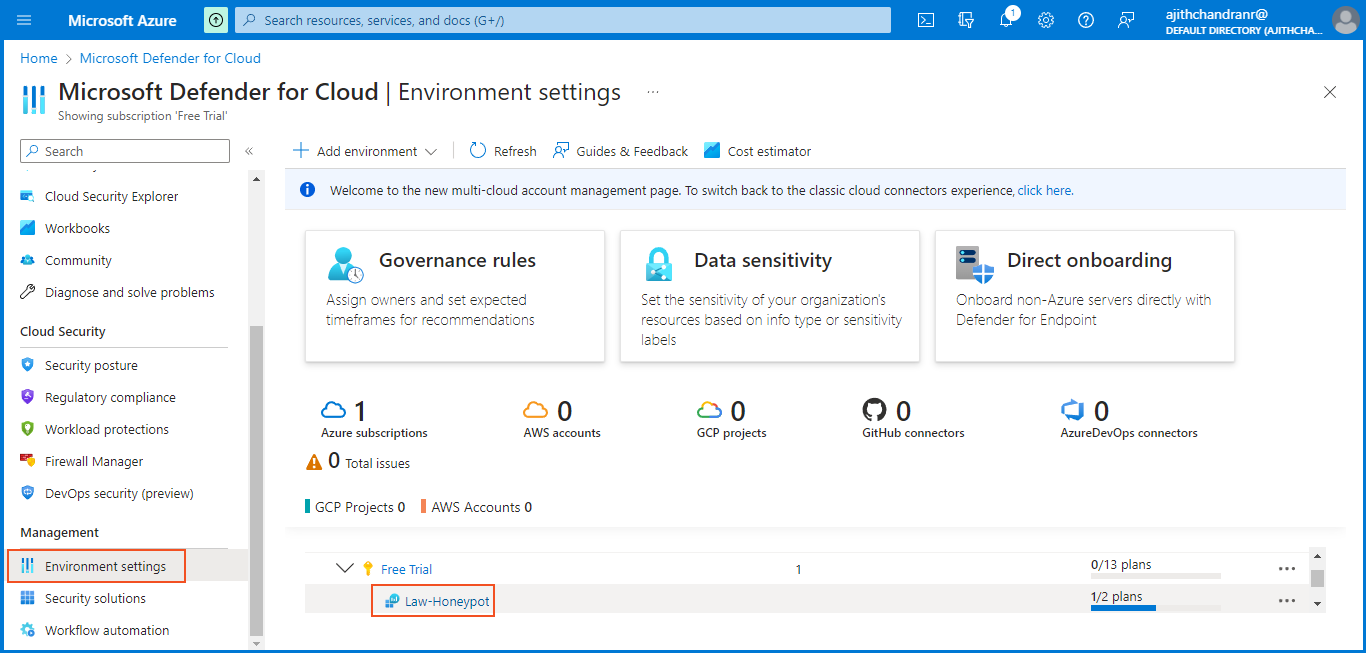
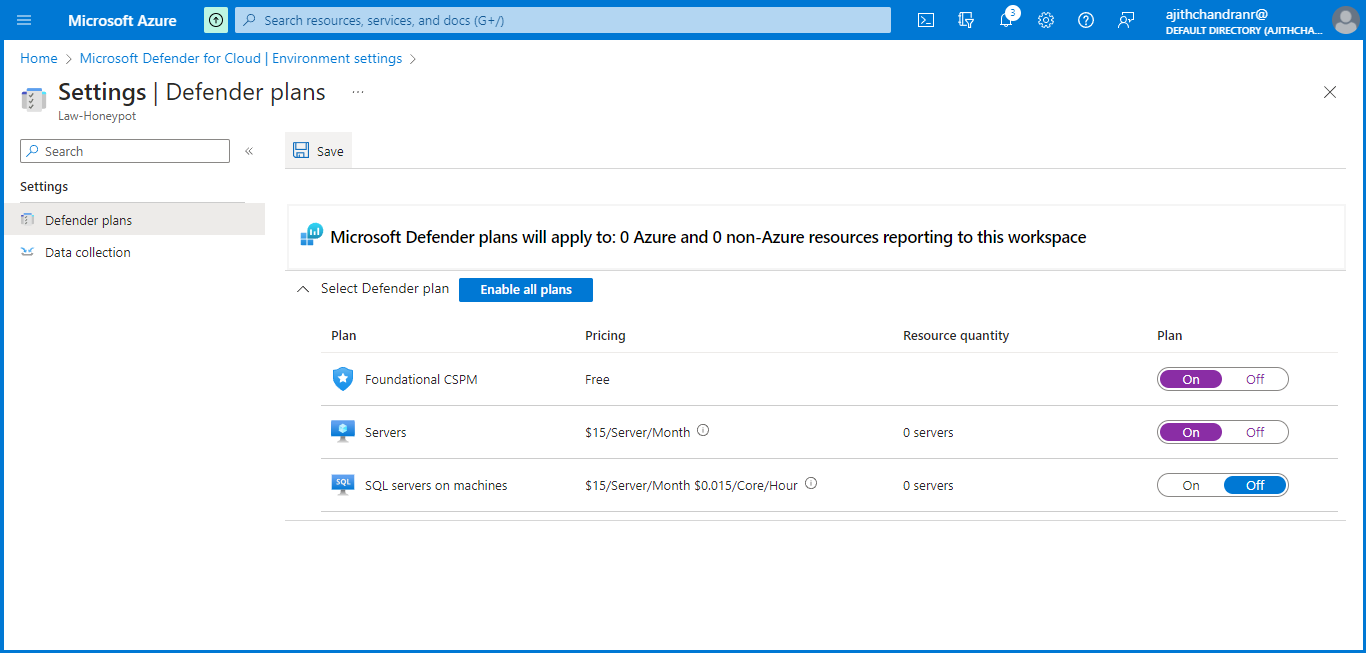
Next, we will proceed to "Microsoft Defender for Cloud". In the "Environment Settings" section, click on "Defender Plans" and activate only the plans for Foundational CSPM and Servers. Since there are no SQL servers in use, there is no need to enable that option. Be sure to save the settings after making these changes.
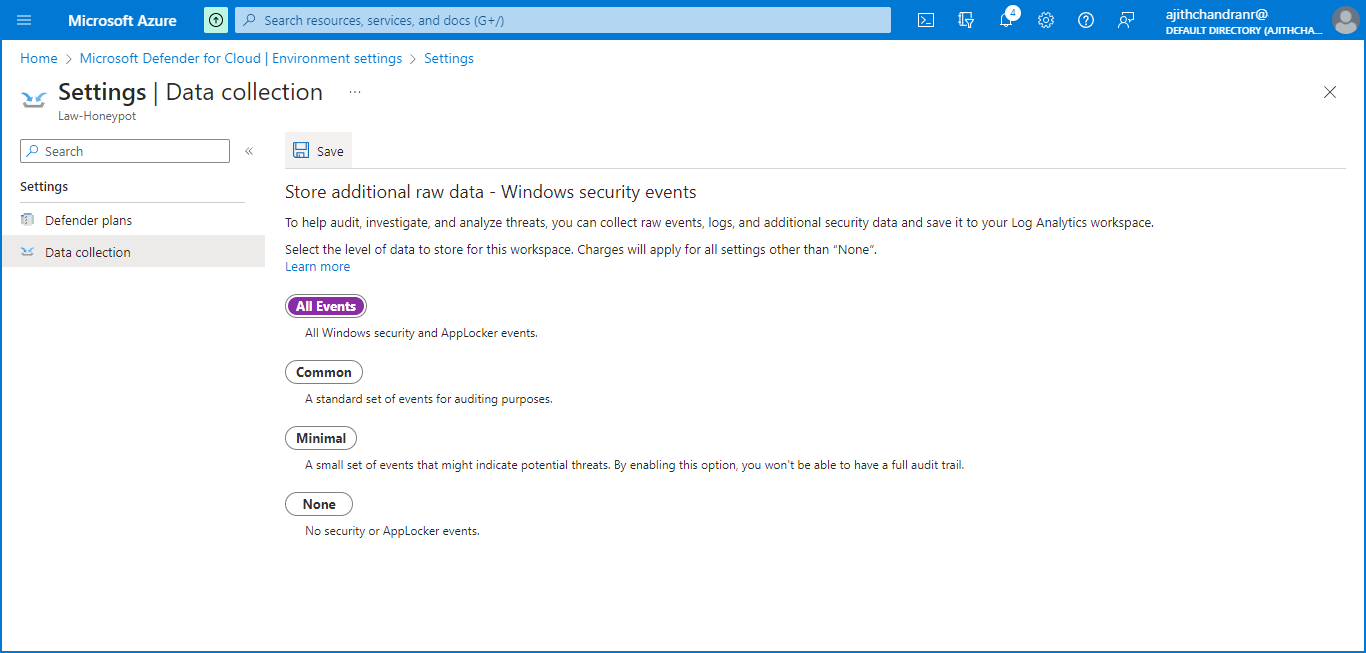
To connect Log Analytics to the VM, navigate to the "Data Collection" section on the left-hand side and select it. Choose the option to collect "all events" and save the settings accordingly. Once the changes are saved, Log Analytics will be successfully connected to the VM.
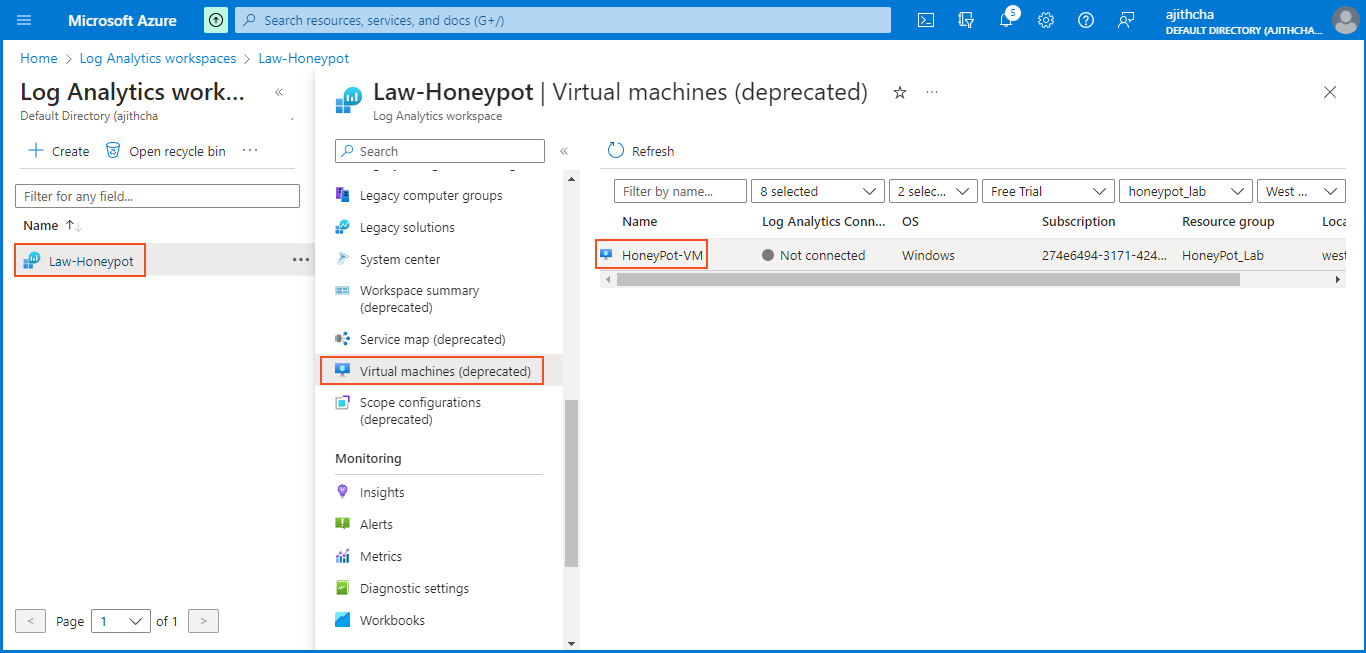
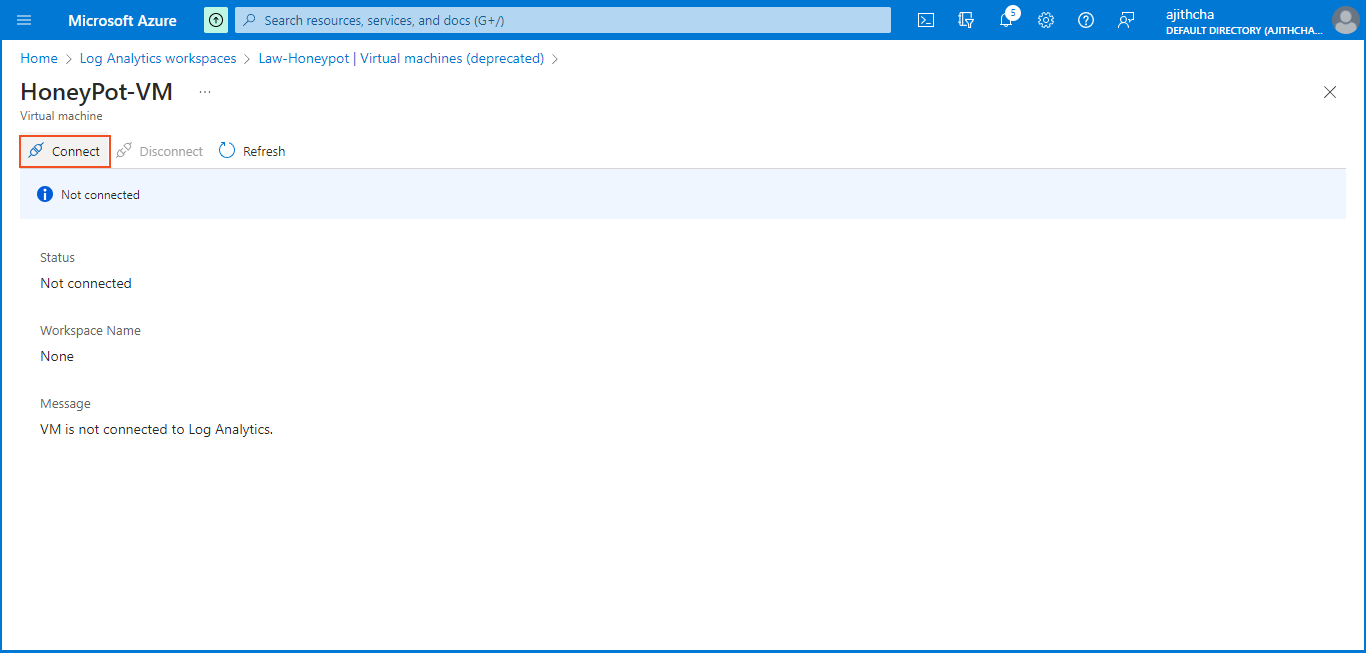
I returned to the Log Analytics Workspace. There, I selected "Law-Honeypot" and chose "Virtual Machines(deprecated)". From the list that appeared, I clicked on the virtual machine I had previously created. Finally, I established the connection between the Log Analytics Workspace and the virtual machine by clicking on "Connect".
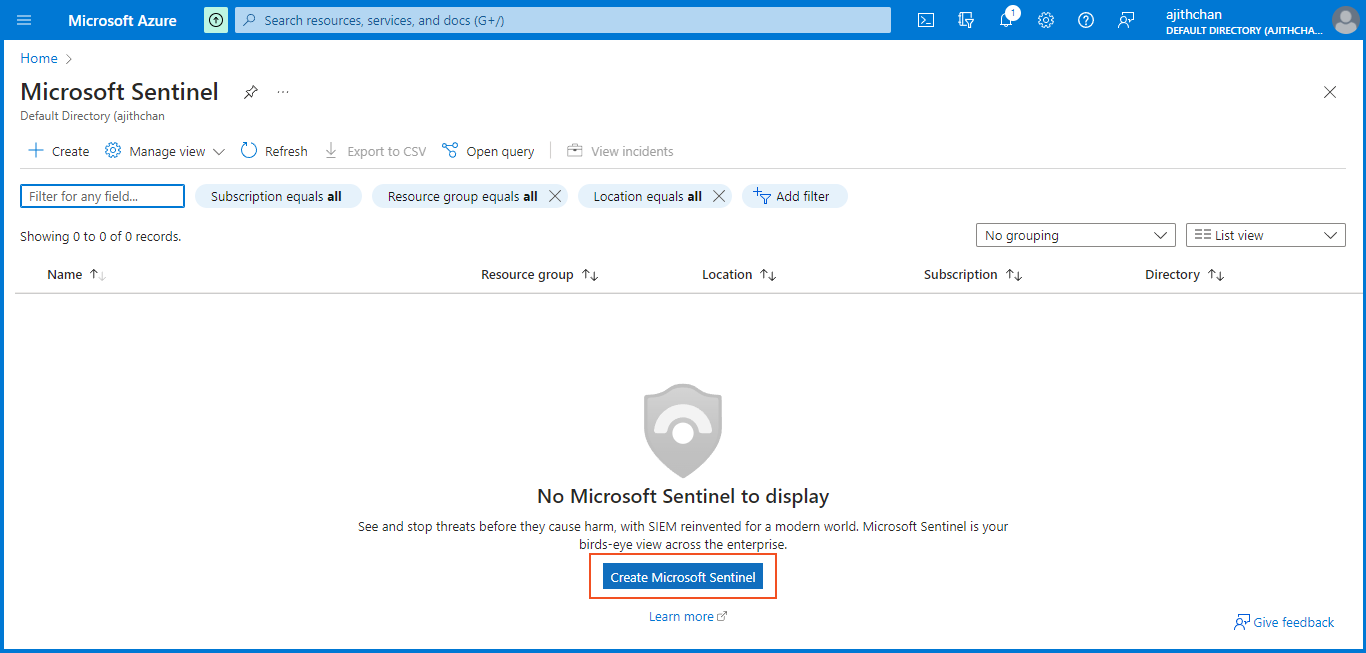
Now, we will set up Sentinel, our SIEM tool, which will enable us to visualize the attack data.
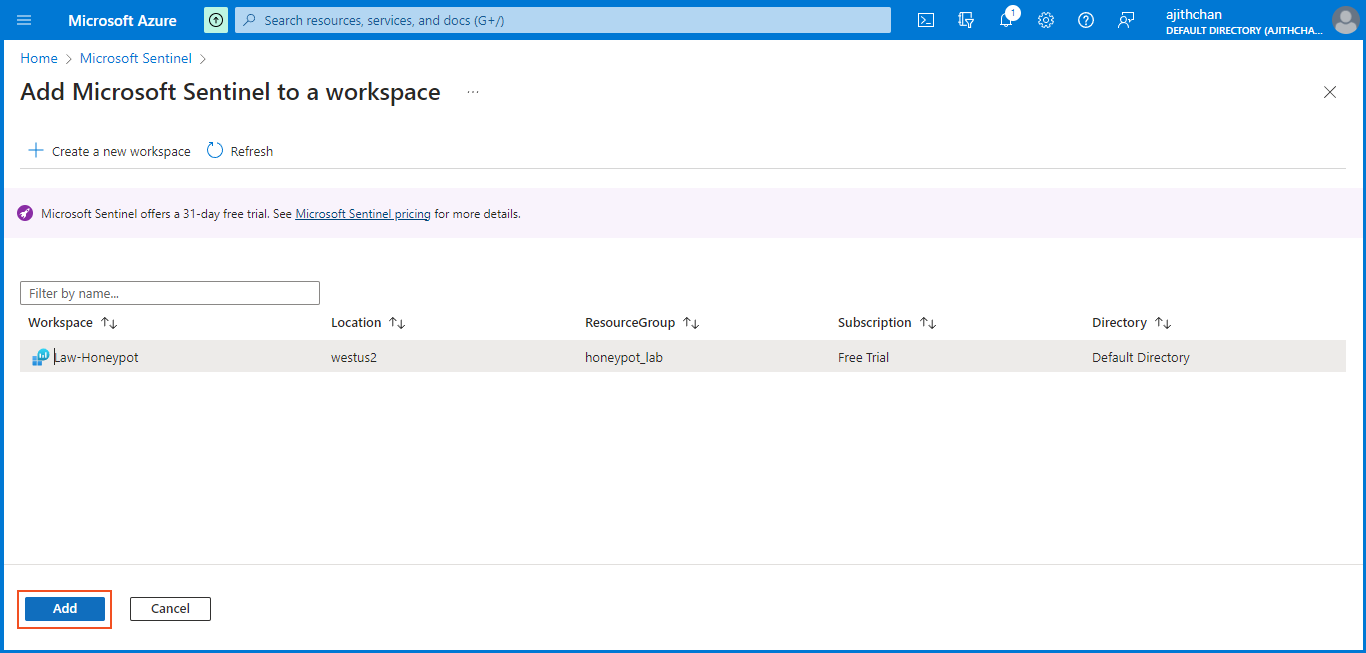
In the Azure Sentinel interface, click on "Create Microsoft Sentinel" to initiate the setup process. Create an Azure Sentinel instance and select the Log Analytics workspace (Law-Honeypot) for connection. Finally, click on "add" to establish the connection.
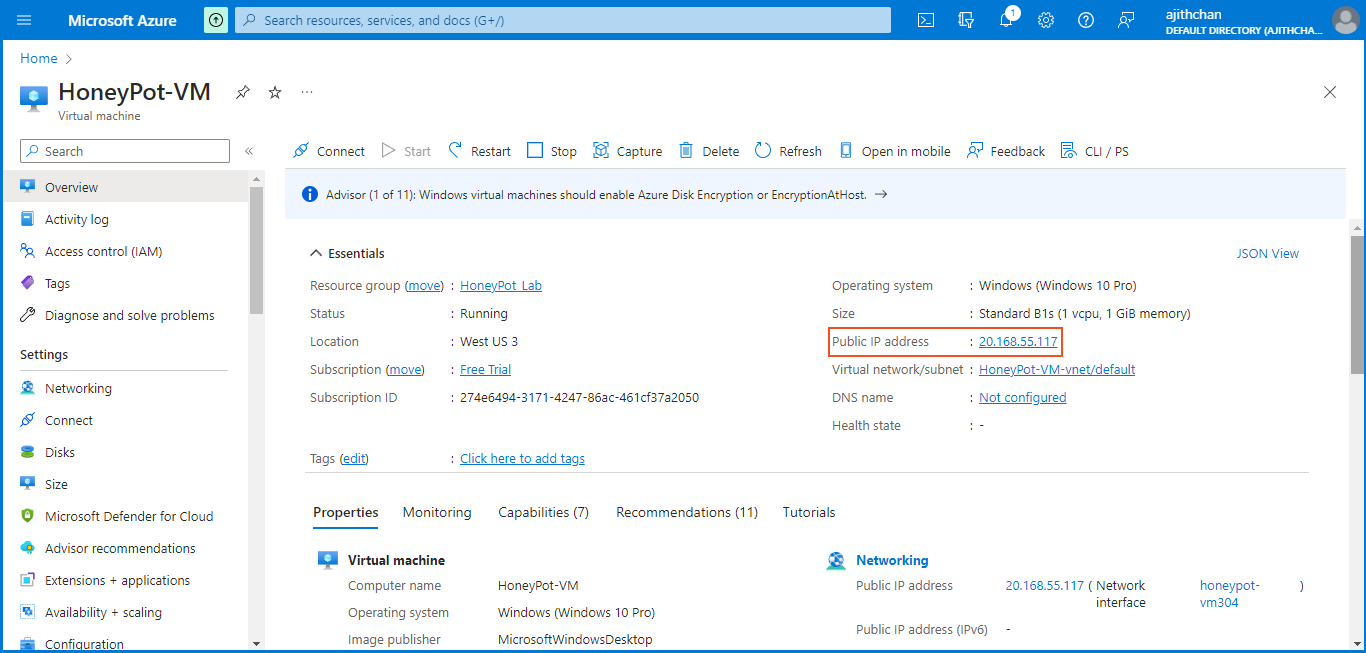
Now that the Azure dashboard is all set up, I can proceed to configure my VM. To begin, I need to retrieve the "public IP address" of the VM so that I can establish a Remote Desktop (RDP) connection. In the Azure portal, I navigate to the Virtual Machines tab, locate the HoneyPot VM, and find the public IP address.
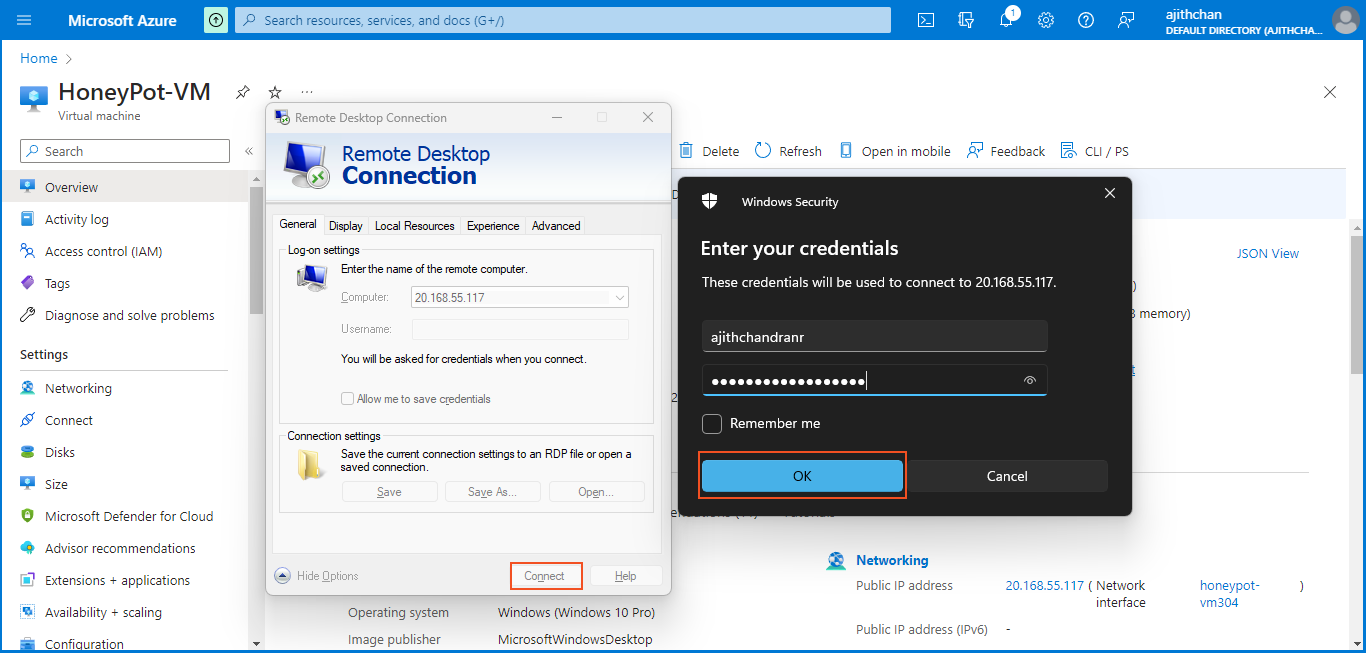
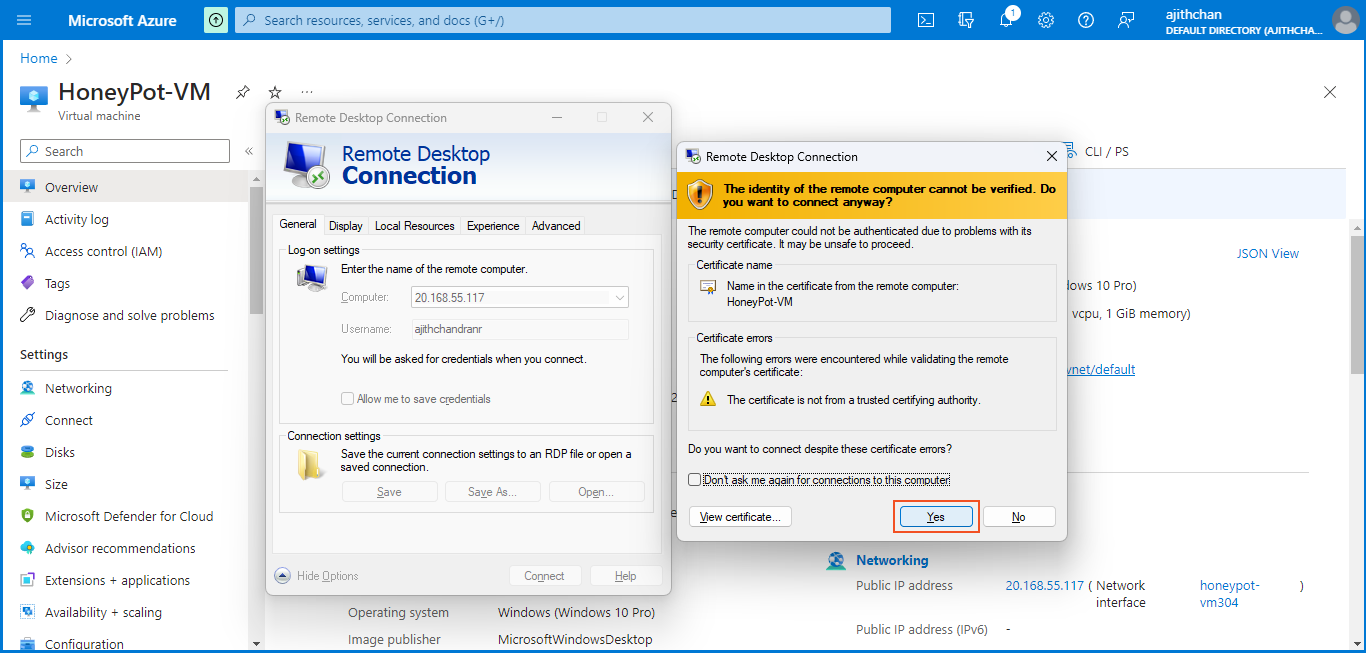
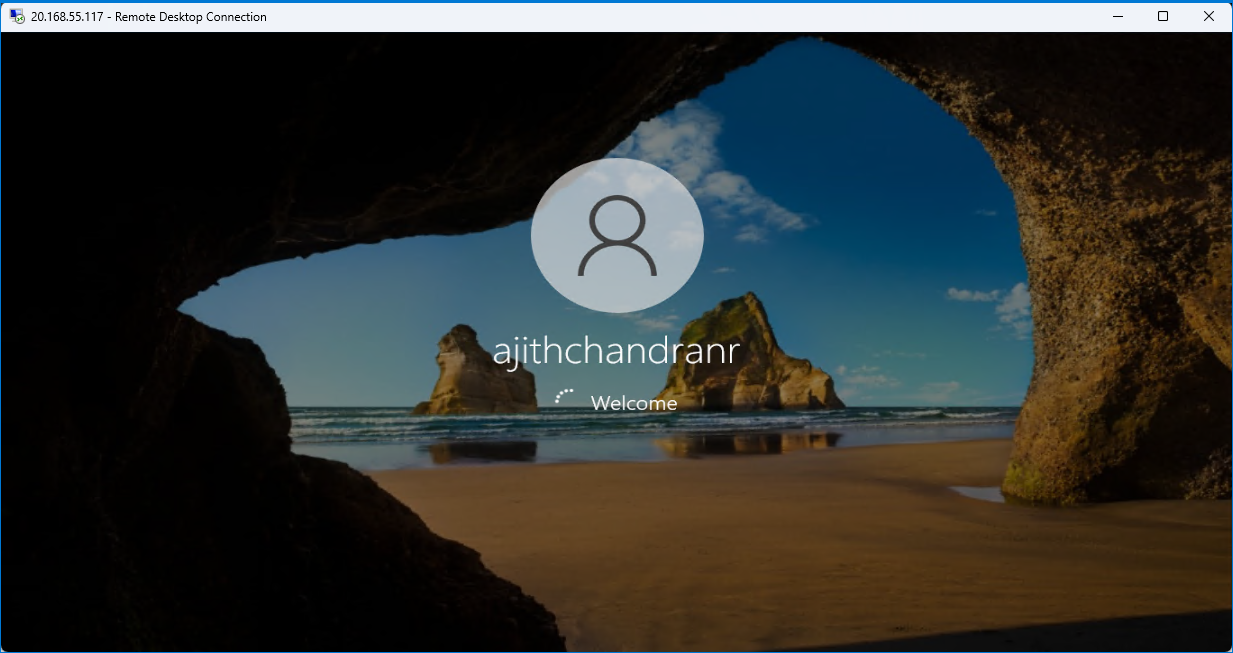
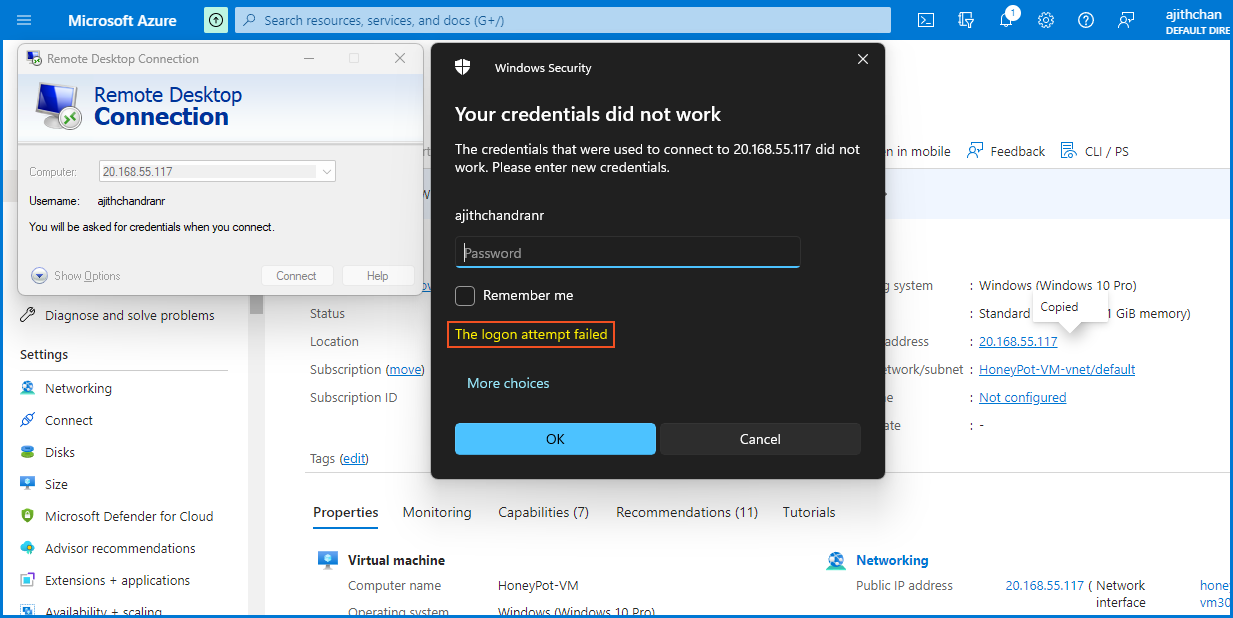
Now, I have the ability to access my VM using Remote Desktop. To do so, I open the Remote Desktop application on my native PC. I enter the VM's public IP address and click on "Connect". Then, I provide the necessary VM credentials and proceed to establish the connection.
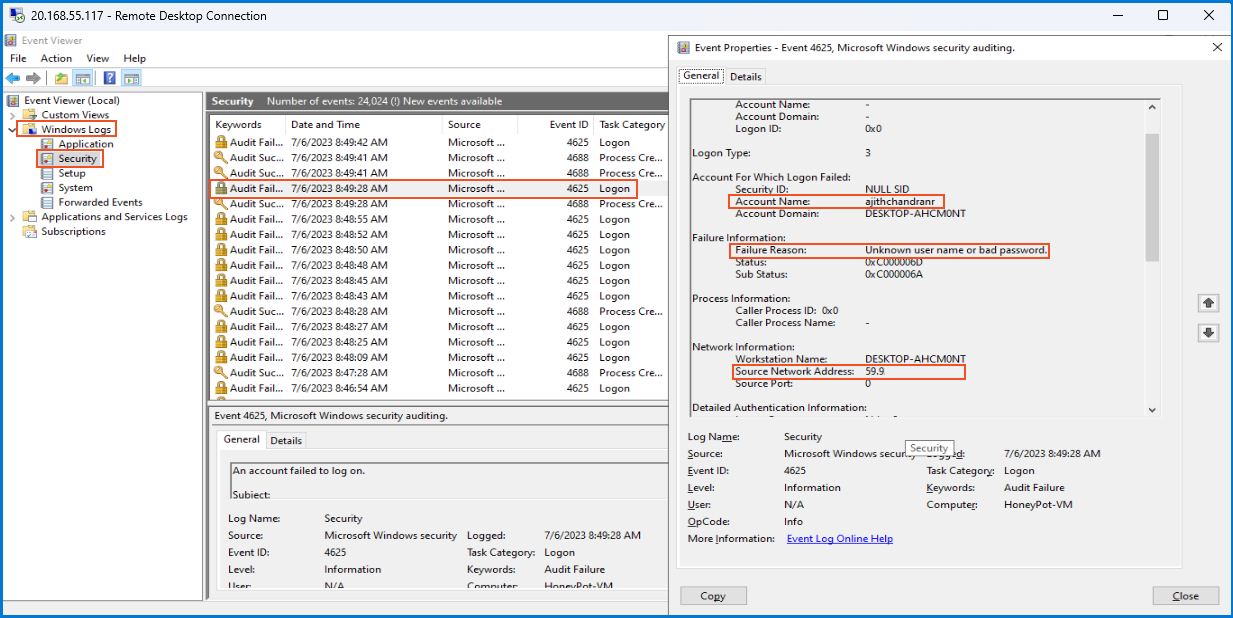
After logging into the VM via RDP, I access the Event Viewer's "Security" section in "Windows Logs." It logs various Windows system activities with unique EventIDs. Our project focuses on "EventID 4625", indicating Failed Logon Attempts in the Security tab.
To demonstrate, I intentionally initiate another RDP session and enter an incorrect password during the VM login. The Event Viewer records this failed logon attempt, displaying details such as the username, target machine, failure reason, and IP address used. As more people find and use this setup, the Event Viewer gathers a variety of IP addresses, which enhances our data analysis.
In my plan, I programmatically use "PowerShell" to extract the IP address from the "Event Viewer". Then, I utilize an "IP geolocation API" by sending the IP address as a request to https://www.abstractapi.com. The API provides valuable information such as the country, state/province, city, latitude, and longitude associated with the IP address. This data is used to create a custom log that I send to a "Log Analytics workspace" in Azure. Finally, I leverage "Microsoft Sentinel" to read the latitude, longitude, or country information and plot the attackers' locations on a map.
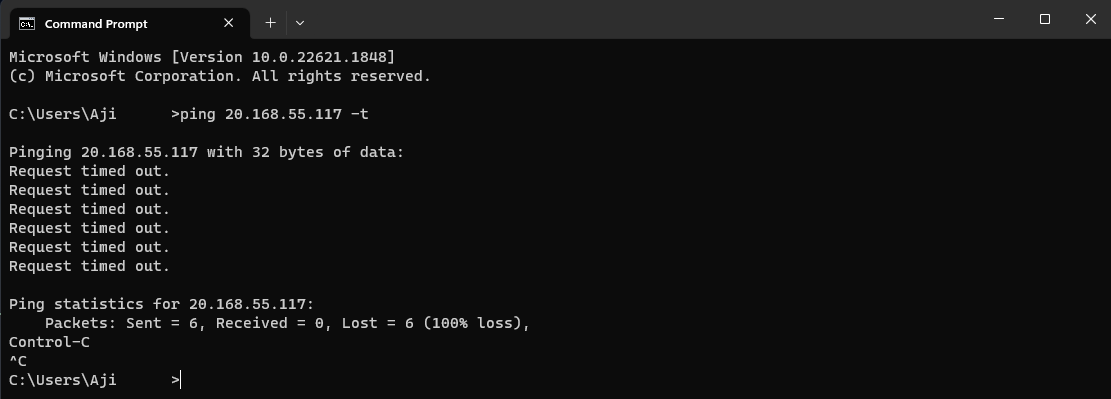
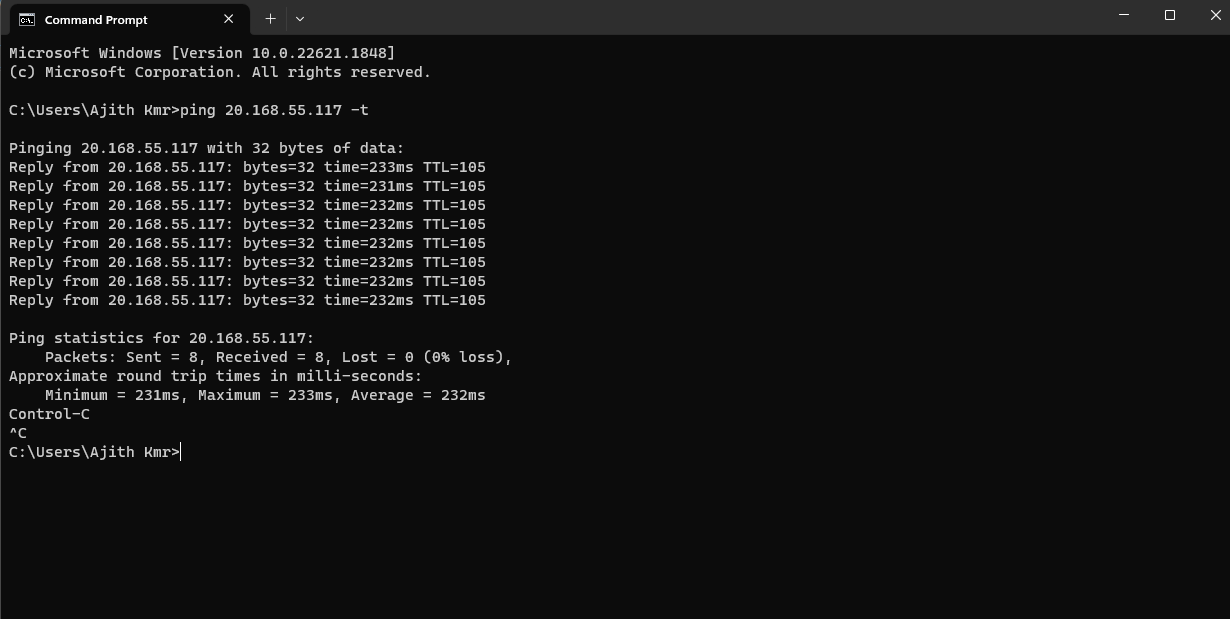
As the next step, I attempt to ping the VM from my native computer to establish a direct connection and check its discoverability. However, I find that the VM is not discoverable. This is due to the "Windows Defender Firewall" being enabled on the VM. The firewall is blocking ICMP Echo Requests, which are necessary for successful pinging. I confirm this by pinging the VM's public IP address, 20.168.55.117, and receiving "Request timed out" messages several times. The firewall is actively dropping the ICMP request packets.
To enable my VM to be "discoverable" on the internet, I accessed the Windows Firewall settings on the VM by searching for "wf.msc" in the Windows search bar.
Then, I clicked on "Windows Defender Firewall Properties" and turned "off" the "Firewall state" for the "Domain profile, Public profile, and Private profile". After applying the settings, I used the command prompt on my native computer to ping the VM once again. This time, the VM responded with replies as the firewall was no longer blocking ICMP requests.
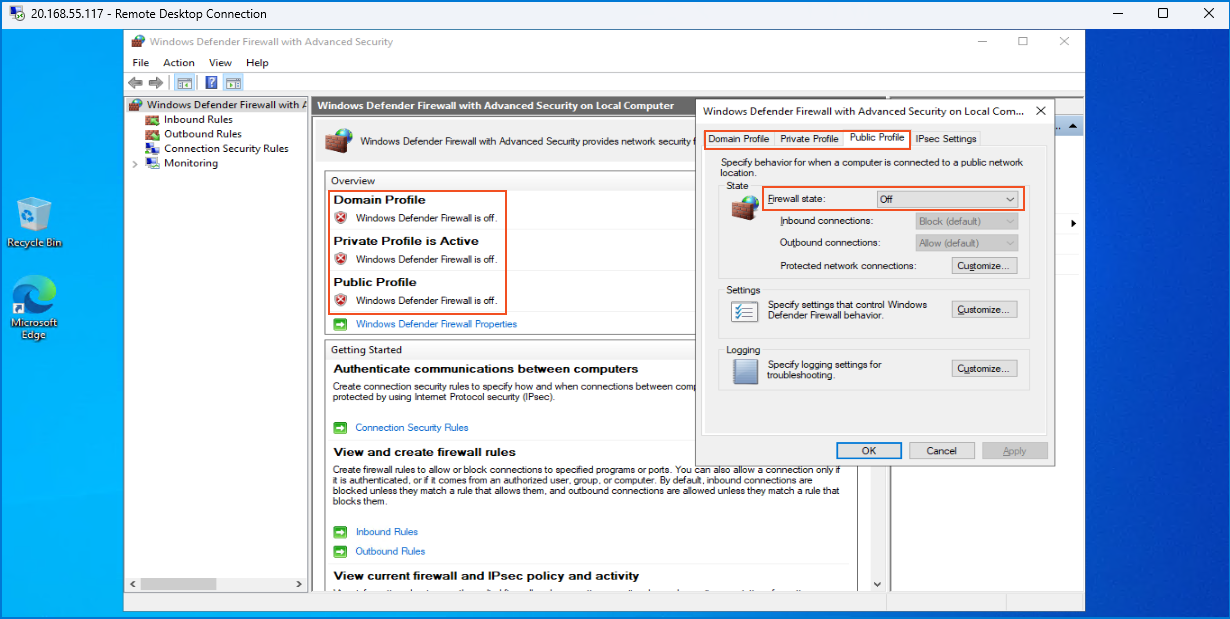
For testing purposes in the lab environment, I have temporarily disabled the firewall. However, it is important to note that disabling the firewall should never be done in a real-life production environment.
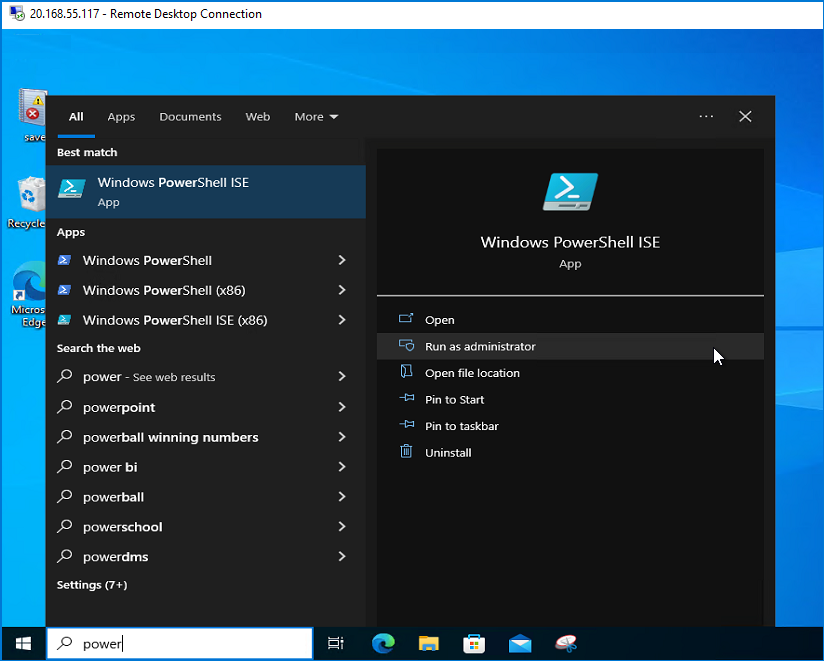
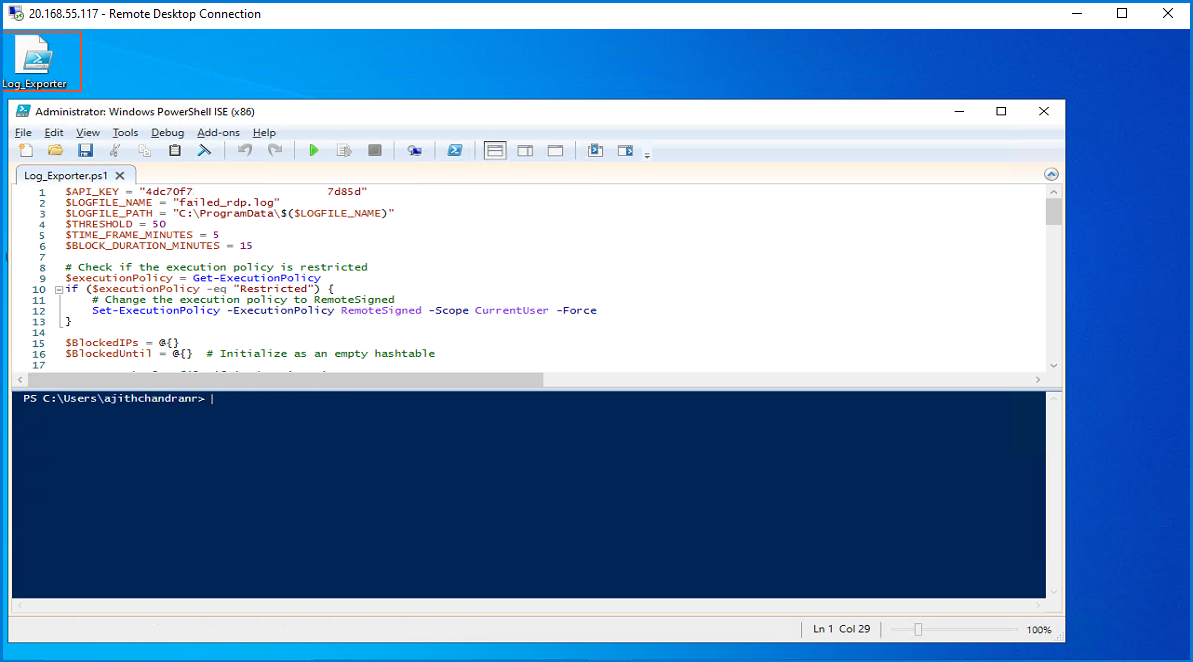
Now that my VM is accessible on the internet, I proceed to set up the essential "PowerShell script". To do so, I visited the GitHub page of "Josh Madakor," one of the mentors, and used his script as a reference for my work. After obtaining the script, I made modifications according to my requirements. Then, I opened "PowerShell ISE" and pasted the modified script into the editor. I save the script as a file named "Log_Exporter".
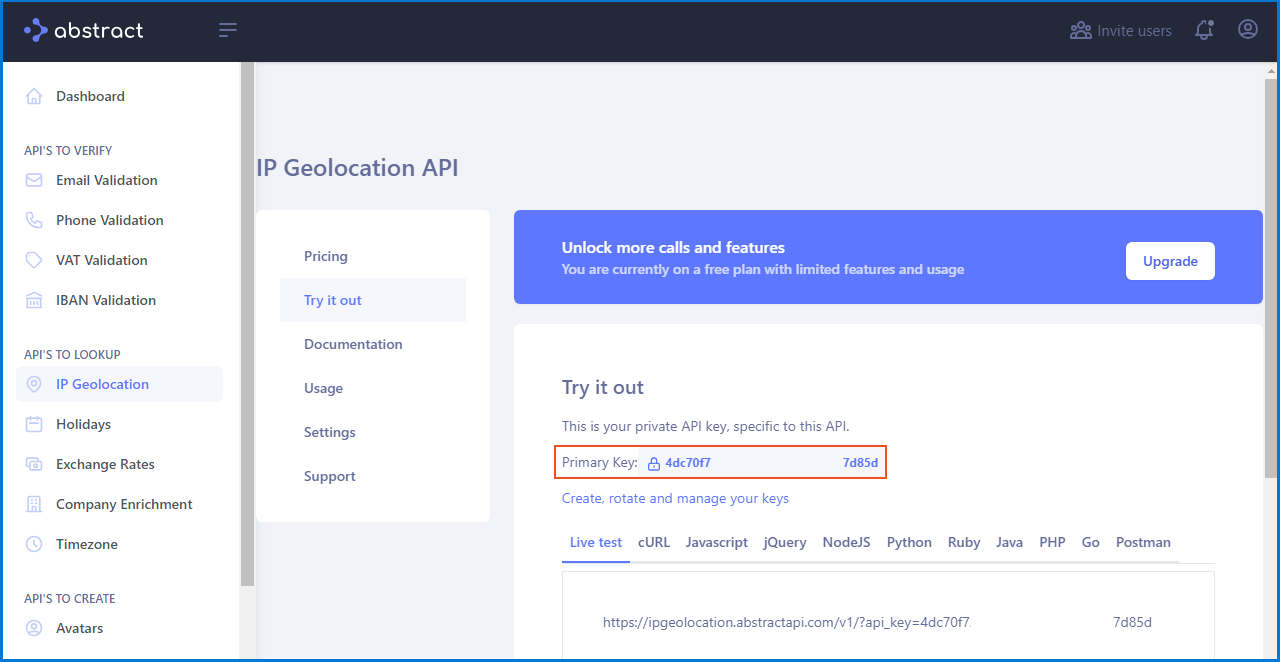
$API_KEY = "4dc70f7********************7d85d"
$LOGFILE_NAME = "failed_rdp.log"
$LOGFILE_PATH = "C:\ProgramData\$($LOGFILE_NAME)"
$THRESHOLD = 50
$TIME_FRAME_MINUTES = 5
$BLOCK_DURATION_MINUTES = 15

# Check if the execution policy is restricted
$executionPolicy = Get-ExecutionPolicy
if ($executionPolicy -eq "Restricted") {
    # Change the execution policy to RemoteSigned
    Set-ExecutionPolicy -ExecutionPolicy RemoteSigned -Scope CurrentUser -Force
}

$BlockedIPs = @{}
$BlockedUntil = @{}  # Initialize as an empty hashtable

# Create the log file if it doesn't exist
if (-not (Test-Path -Path $LOGFILE_PATH)) {
    New-Item -ItemType File -Path $LOGFILE_PATH | Out-Null
}

$XMLFilter = @'
<QueryList>
   <Query Id="0" Path="Security">
         <Select Path="Security">
              *[System[(EventID='4625')]]
          </Select>
    </Query>
</QueryList>
'@

while ($true) {
    Start-Sleep -Milliseconds 1000

    $events = Get-WinEvent -FilterXml $XMLFilter -MaxEvents 100 -ErrorAction SilentlyContinue

    foreach ($event in $events) {
        if ($event.properties[19].Value.Length -ge 5) {
            $timestamp = $event.TimeCreated.ToString("yyyy-MM-dd HH:mm:ss")
            $destinationHost = $event.MachineName
            $username = $event.properties[5].Value
            $sourceIp = $event.properties[19].Value

            $log_contents = Get-Content -Path $LOGFILE_PATH

            if (-not ($log_contents -match "$($timestamp)") -or ($log_contents.Length -eq 0)) {
                if ($BlockedUntil.ContainsKey($sourceIp) -and $BlockedUntil[$sourceIp] -gt (Get-Date)) {
                    Write-Host -BackgroundColor Black -ForegroundColor Red "IP $($sourceIp) is blocked. Skipping API call."
                    continue
                }

                Start-Sleep -Milliseconds 1000

                $API_ENDPOINT = "https://ipgeolocation.abstractapi.com/v1/?api_key=$($API_KEY)&ip_address=$($sourceIp)"
                $response = Invoke-RestMethod -Uri $API_ENDPOINT

                if (-not $response.error) {
                    $latitude = $response.latitude
                    $longitude = $response.longitude
                    $country = $response.country
                    $region = $response.region
                    $city = $response.city

                    $logEntry = "latitude:$($latitude),longitude:$($longitude),destinationhost:$($destinationHost),username:$($username),sourcehost:$($sourceIp),state:$($region),country:$($country),label:$($country) - $($sourceIp),timestamp:$($timestamp)"
                    Add-Content -Path $LOGFILE_PATH -Value $logEntry -Encoding utf8

                    Write-Host -BackgroundColor Black -ForegroundColor Yellow $logEntry
                    Write-Host ""  # Add a blank line

                    if ($BlockedIPs.ContainsKey($sourceIp)) {
                        $BlockedIPs[$sourceIp]++
                    } else {
                        $BlockedIPs[$sourceIp] = 1
                    }

                    if ($BlockedIPs[$sourceIp] -gt $THRESHOLD) {
                        $blockUntil = (Get-Date).AddMinutes($BLOCK_DURATION_MINUTES)
                        $BlockedUntil[$sourceIp] = $blockUntil
                        $blockUntilFormatted = $blockUntil.ToString("yyyy-MM-dd HH:mm:ss")
                        $blockMessage = "IP $($sourceIp) exceeded the threshold. Blocking until: $blockUntilFormatted"
                        Write-Host -BackgroundColor Black -ForegroundColor Red $blockMessage
                        Write-Host ""  # Add a blank line
                    }
                } else {
                    Write-Host -BackgroundColor Black -ForegroundColor Red "Error retrieving geolocation for IP $($sourceIp): $($response.error.message)"
                    Write-Host ""  # Add a blank line
                }
            }
        }
    }
}
Please allow me to elaborate on some of the code utilized in this script.
-
"$THRESHOLD": This variable sets the maximum number of failed RDP login attempts allowed from a single IP address. If the count of failed attempts exceeds this threshold, the IP address will be blocked to prevent further login attempts.
-
"$TIME_FRAME_MINUTES": This variable defines a time frame in minutes within which the script considers failed login attempts. Only failed attempts that occurred within this specified time frame will be counted towards the threshold. Failed attempts that are older than the specified time frame will not be considered.
-
"$BLOCK_DURATION_MINUTES": This variable represents the duration in minutes for which an IP address will be blocked if it exceeds the threshold of failed login attempts. Once an IP address surpasses the threshold, it will be blocked for the specified duration before the block is automatically lifted.
-
"$Get-WinEvent'": It is a PowerShell cmdlet used to retrieve security events from Windows event logs. In this script, 'Get-WinEvent' is specifically used to fetch events related to failed RDP (Remote Desktop Protocol) login attempts. By limiting the retrieval to 100 events at a time, the script can efficiently process multiple events without overwhelming system resources.
"This script monitors failed RDP login attempts and blocks IP addresses for 15 minutes if they exceed 50 attempts within a 5-minute timeframe, preventing brute-force attacks while also maintaining a limit on API calls to gather geolocation data and gain insights into attack diversities from different countries."
To utilize the script, I obtain my own API key from www.abstractapi.com and insert it into the designated location within the script. Afterward, I run the script to initiate its execution. The script continuously analyzes the event log, extracting failed logon events, and retrieves geolocation data for the corresponding, IP addresses. This data is then saved in the "failed_rdp.log" file located in the "C:\ProgramData" folder.
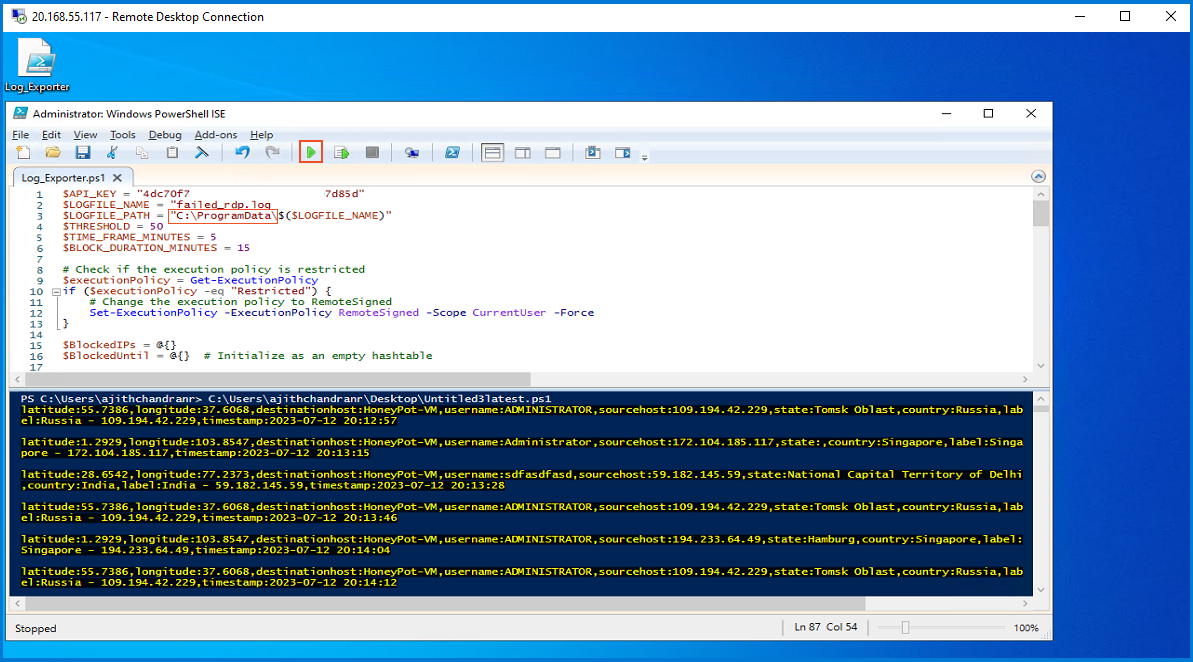
The script is functioning correctly, saving data in the "failed_rdp" logfile as strings. The PowerShell script includes sample data, crucial for training AI models in "Log Analytics Workbooks and Microsoft Sentinel", enhancing precision and accuracy. Later, I will use the logfile to map live attacks in Microsoft Sentinel.
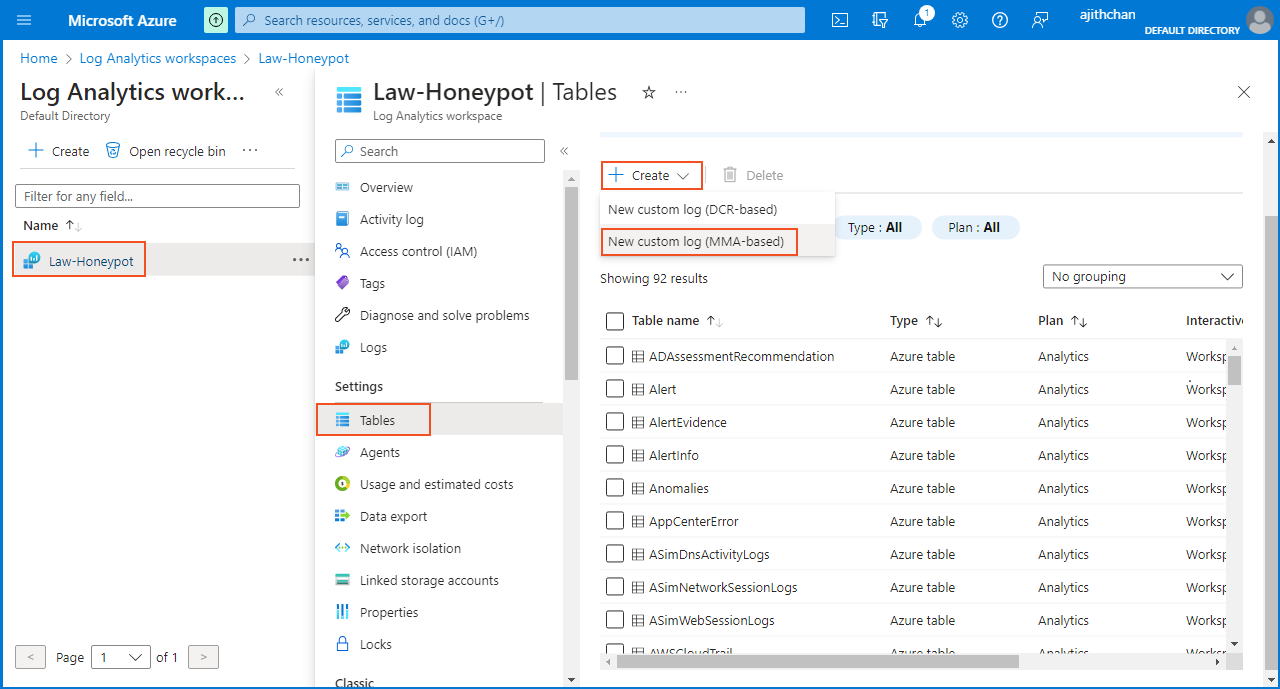
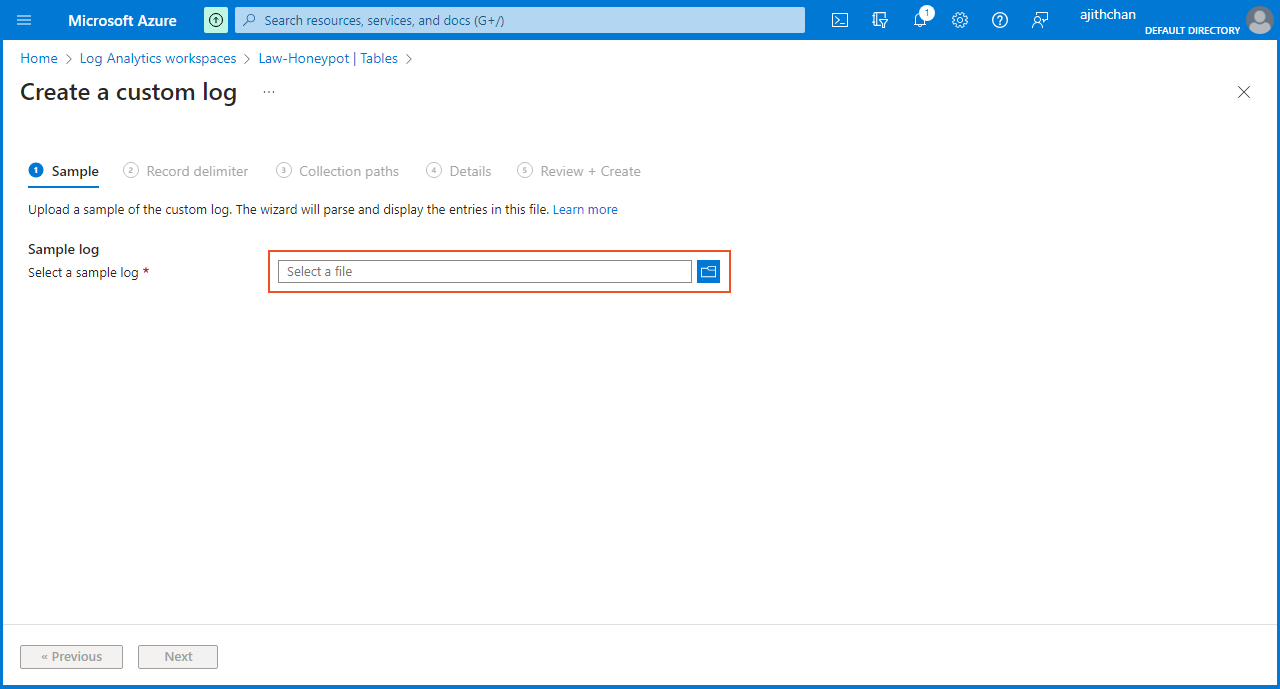
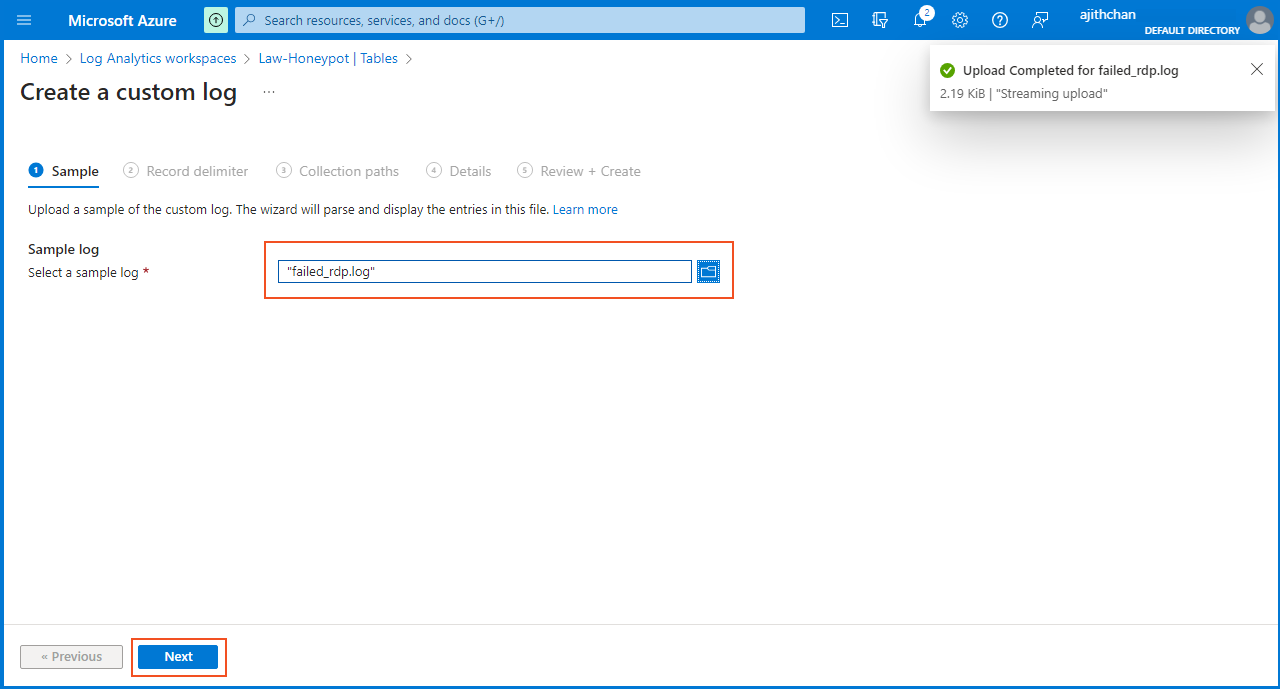
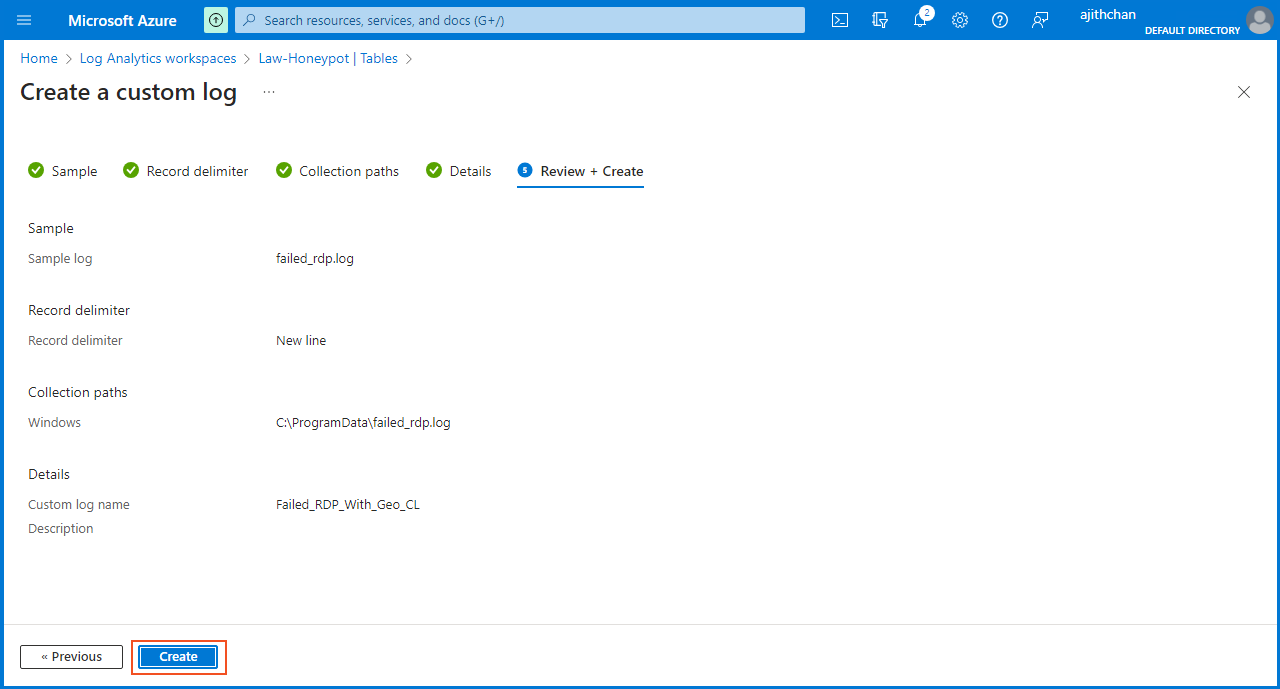
To acquire a sample data for training Log Analytics, I accessed the "Log Analytics Workspace" from the Microsoft Azure homepage. From there, I selected "Law-Honeypot" and clicked on "Tables." Next, I chose "Create" and selected "New custom log (MMA-based)." On the "Create a custom log" page, I was prompted to upload a sample log.
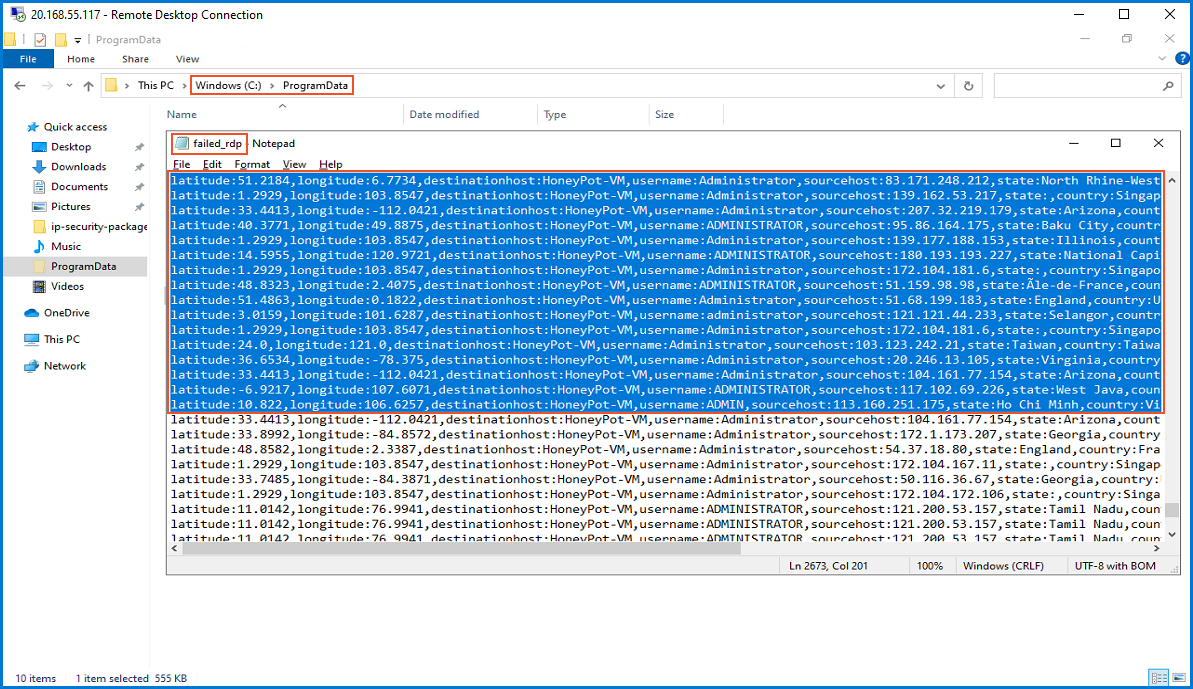
Returning to the VM, I navigated to "C:\ProgramData" and opened the "failed_rdp" log file. After copying a few lines from the log file, I saved the copied content on the local machine using a notepad application, naming it "failed_rdp.log".
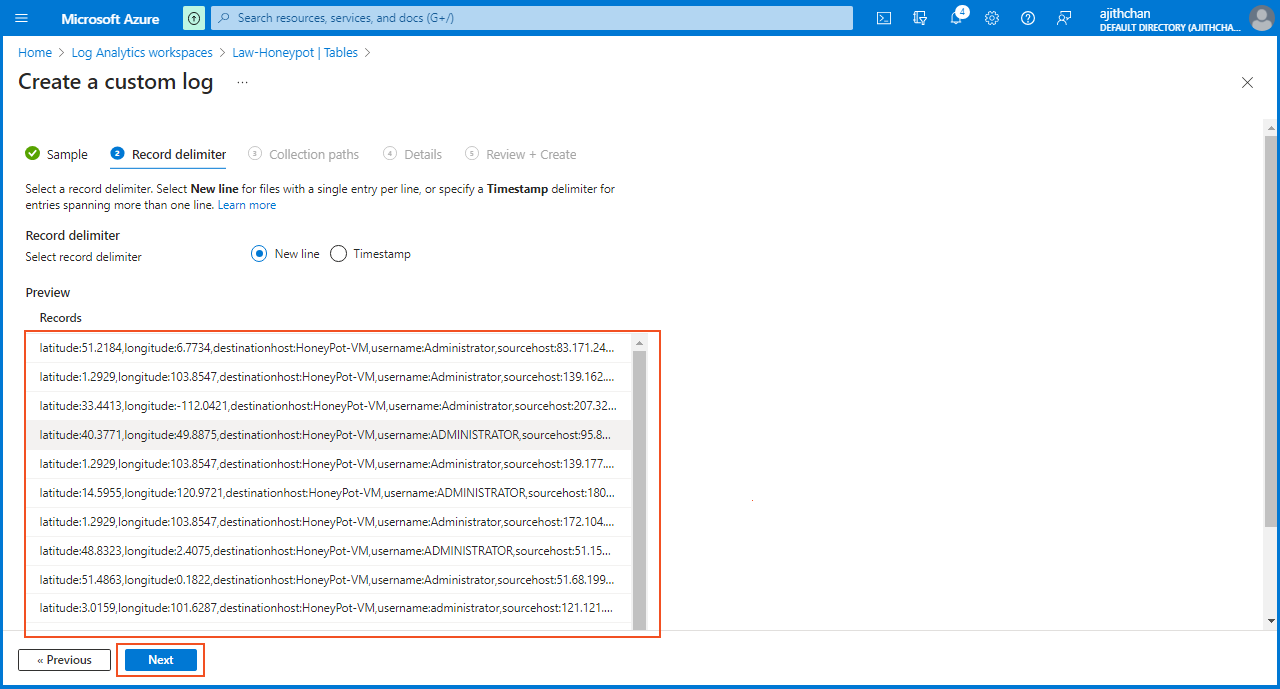
After selecting the "failed_rdp.log" file, I proceeded by clicking on "next." In the "Record Delimiter" section, I selected "New line" and verified the accuracy of the data and then clicked on "next."
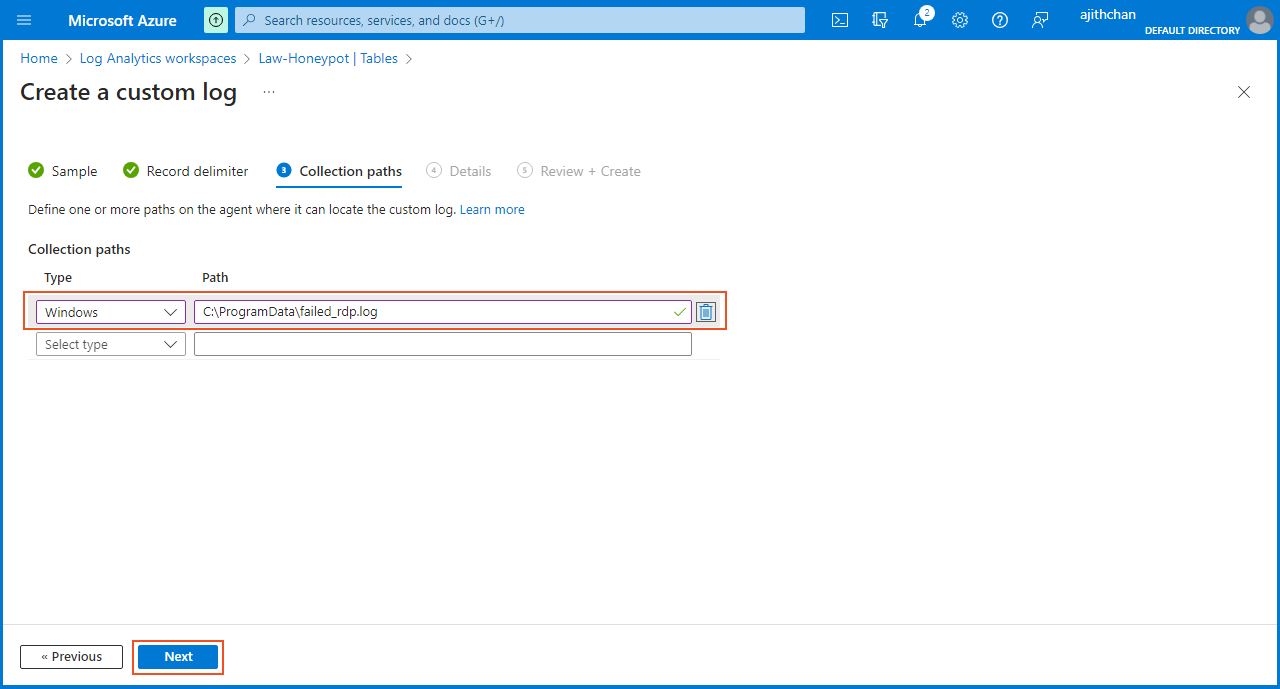
In the "Collection Path" section, I selected the type as "Windows" and specified the path to the log file on the virtual machine as "C:\ProgramData\failed_rdp.log". It is crucial to ensure the accuracy of this path because any errors in the path will prevent the successful collection of the log.
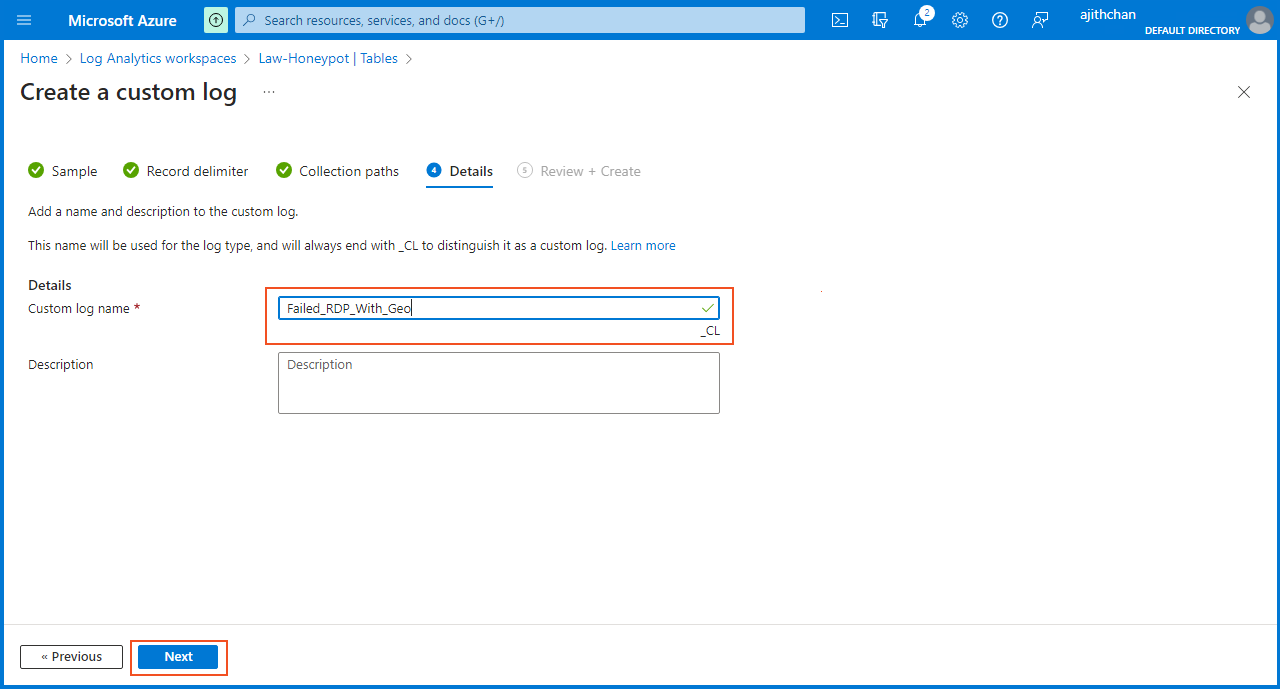
On the "Details" section, I entered "Failed_RDP_With_Geo" as the "Custom log name". I proceed to finish the setup by clicking on "Create" in the "Review + Create" section.
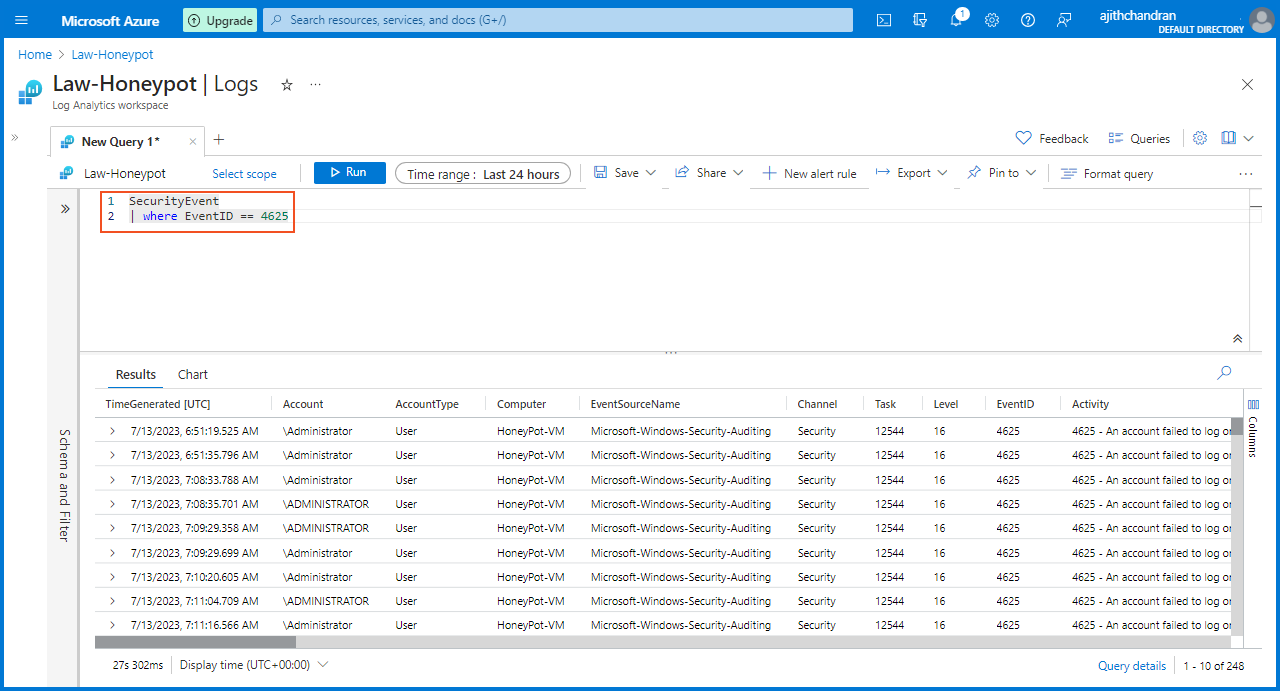
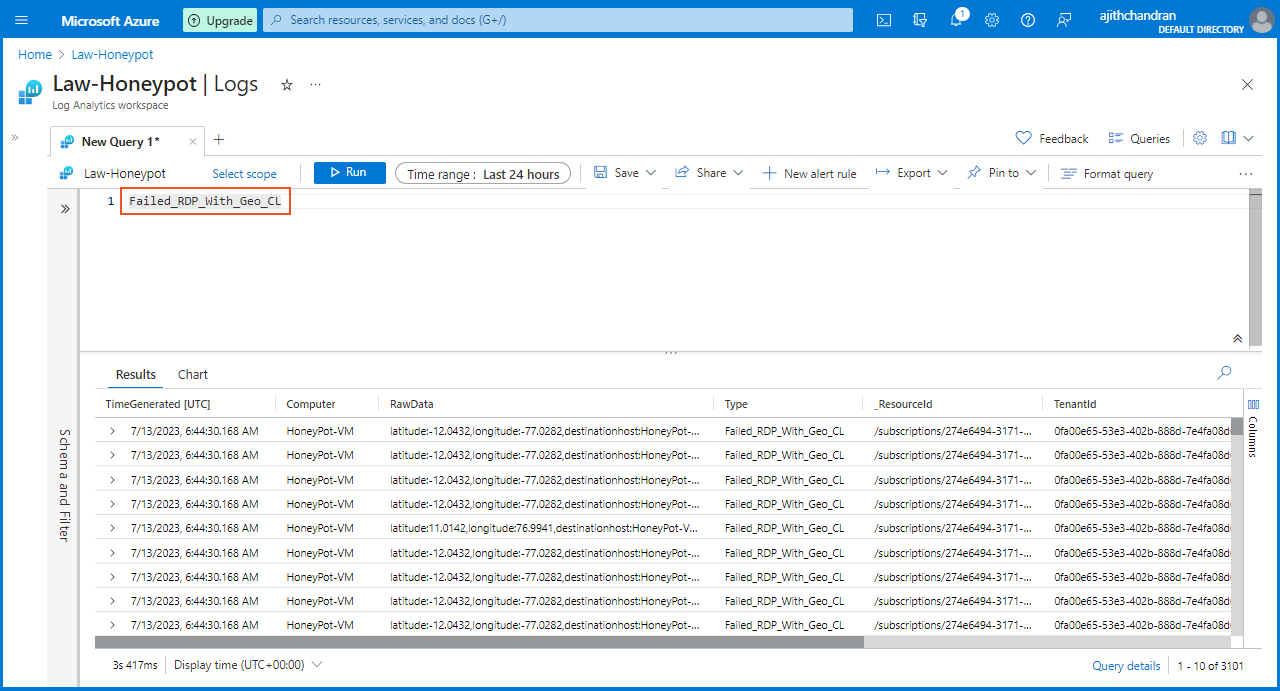
I decided to query the Event Viewer and the newly created "Failed_RDP_With_Geo" custom log to check whether they are working as intended. To do that, on the "Log Analytics Workspace," I selected "Law-Honeypot" and chose "Logs." Then, I entered the following two queries one after another and clicked on "Run"
SecurityEvent
| where EventID == 4625
Failed_RDP_With_Geo_CL
After executing these queries, it is evident that logs are being displayed, confirming the synchronization and successful transmission of data between the VM and Log Analytics.
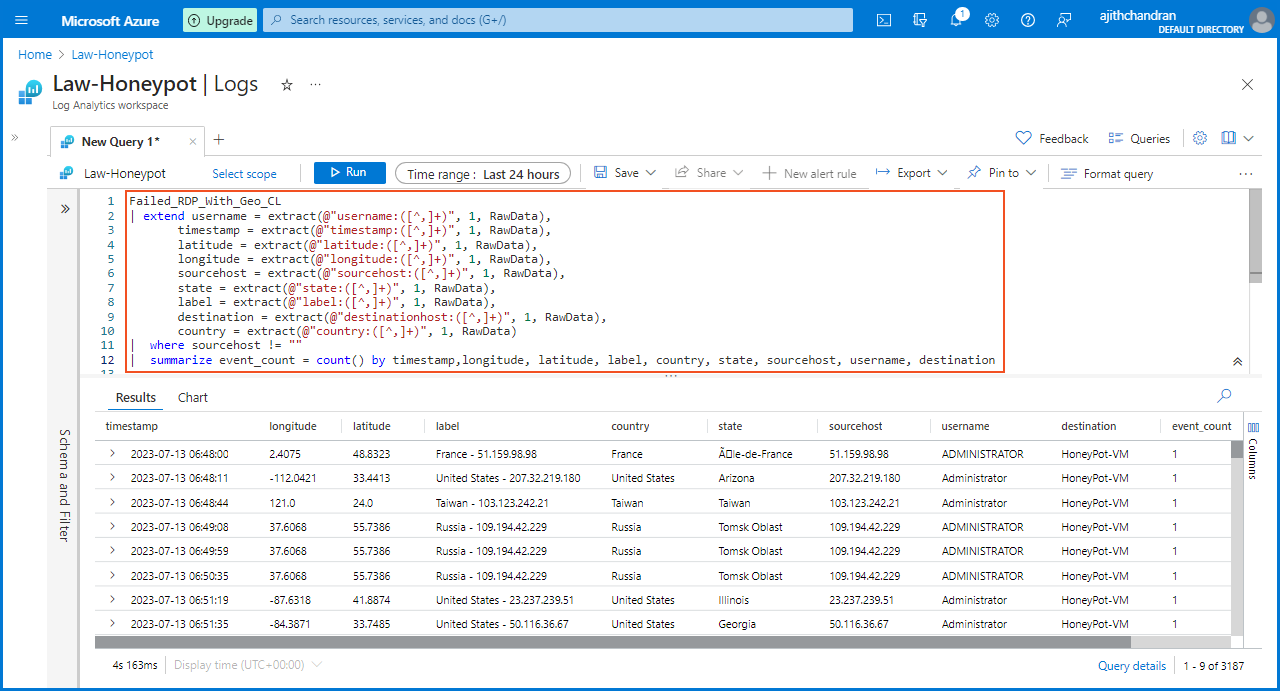
Next, I am extracting specific details from the "raw data" and verifying their correct categorization within the "Log Analytic Workspace". I have used a script that extracts key fields from the "Failed_RDP_With_Geo_CL" dataset, including username, timestamp, latitude, longitude, sourcehost, state, label, destination, and country. The script filters out any entries with the destination labeled as "samplehost" and eliminates records with empty sourcehost values. Finally, the script summarizes the event count based on the extracted fields.
Failed_RDP_With_Geo_CL
| extend username = extract(@"username:([^,]+)", 1, RawData),
       timestamp = extract(@"timestamp:([^,]+)", 1, RawData),
       latitude = extract(@"latitude:([^,]+)", 1, RawData),
       longitude = extract(@"longitude:([^,]+)", 1, RawData),
       sourcehost = extract(@"sourcehost:([^,]+)", 1, RawData),
       state = extract(@"state:([^,]+)", 1, RawData),
       label = extract(@"label:([^,]+)", 1, RawData),
       destination = extract(@"destinationhost:([^,]+)", 1, RawData),
       country = extract(@"country:([^,]+)", 1, RawData)
|  where sourcehost != ""
|  summarize event_count = count() by timestamp, longitude, latitude, label, country, state, sourcehost, username, destination
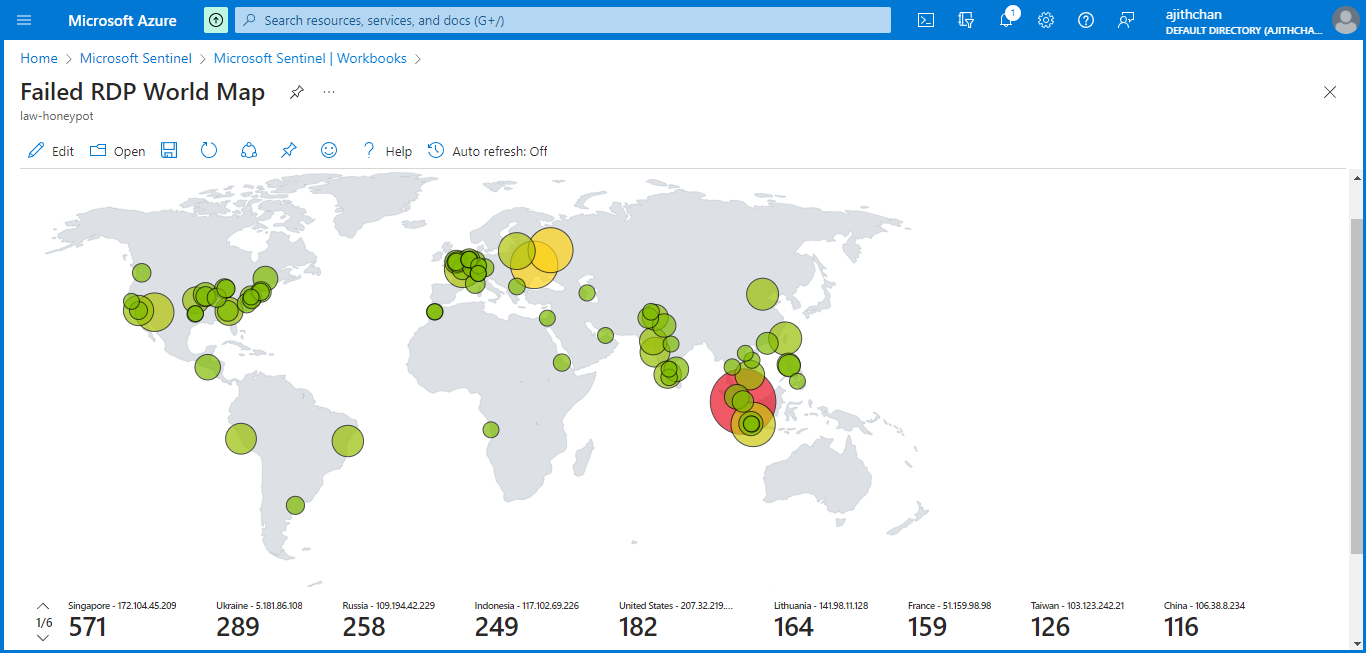
The next step in the process was to initiate the setup of a "geomap" in Sentinel, which would visualize and plot the origins of the attacks or login attempts.
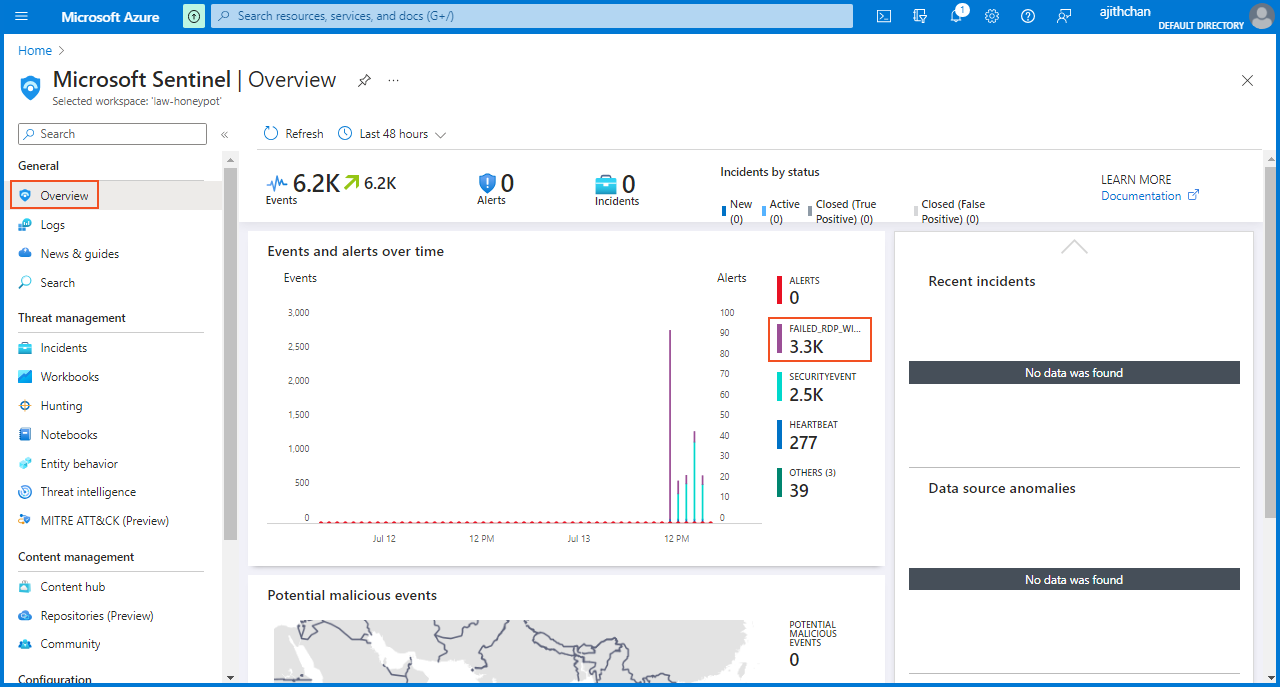
I navigated to "Azure Sentinel" and select the "Law-Honeypot" option. In the "overview" section, I can observe incoming logs and specifically focus on the "Failed RDP with Geolocation" category, which provides a list of corresponding events. These events represent the Security Event logs that originate from the virtual machine.
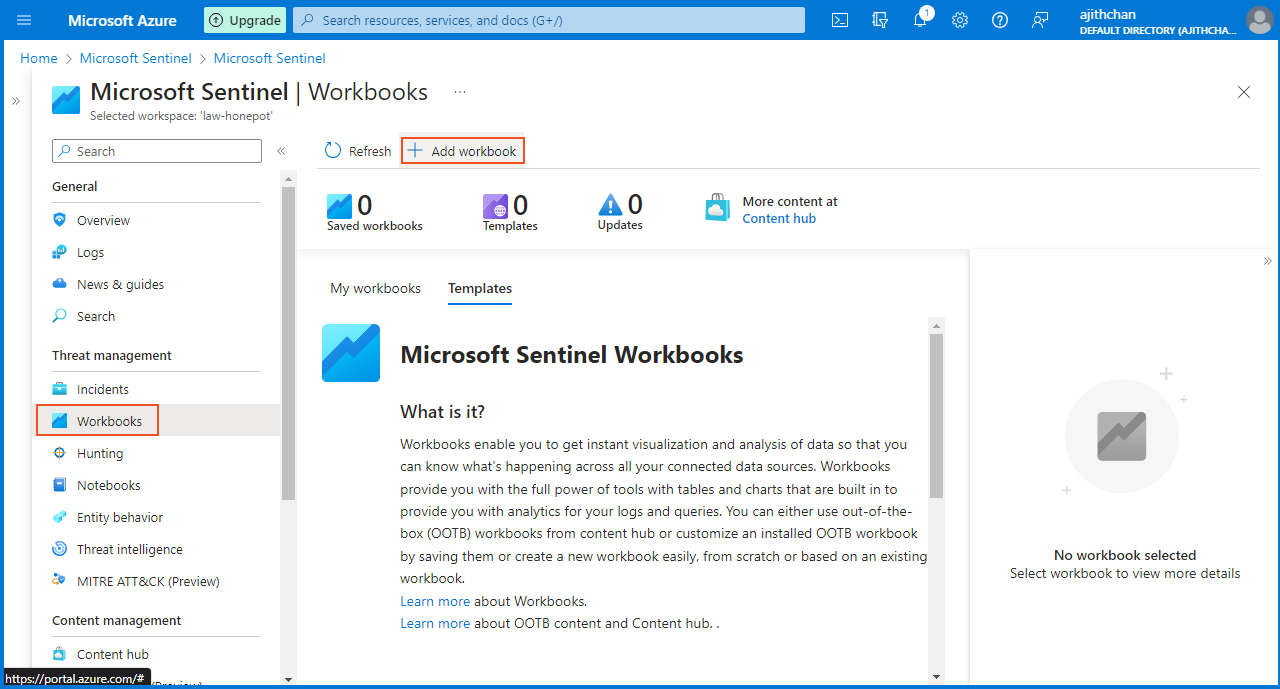
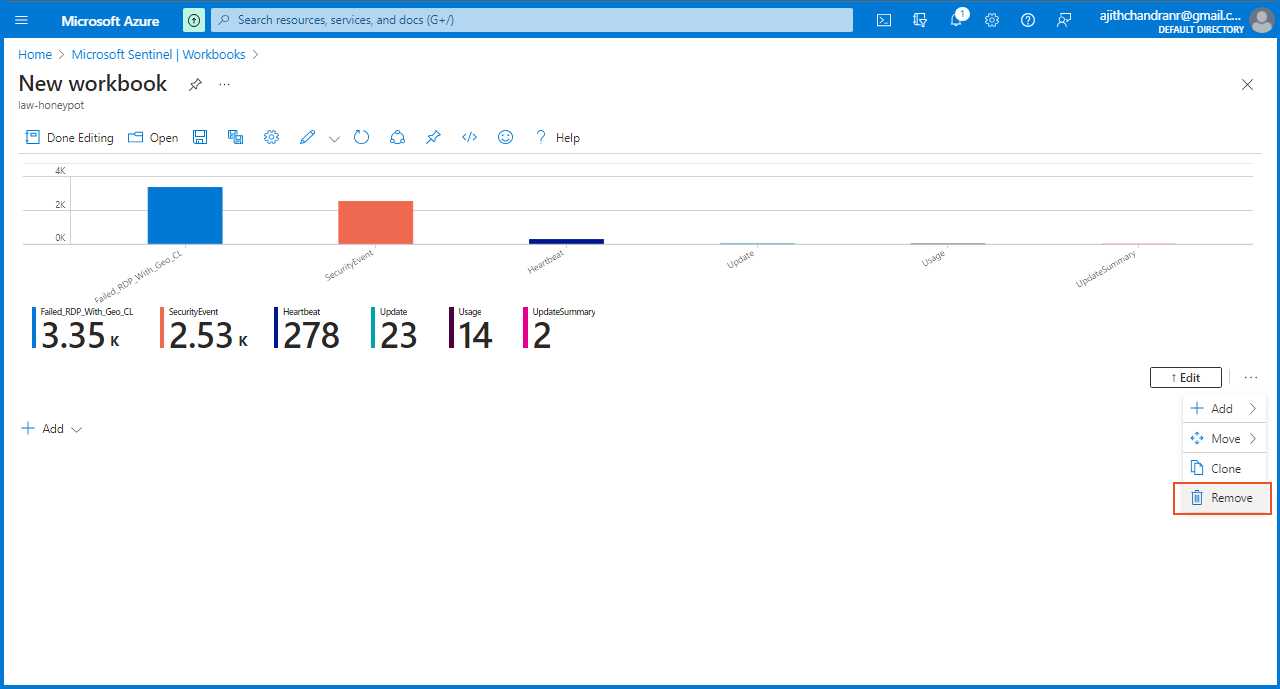
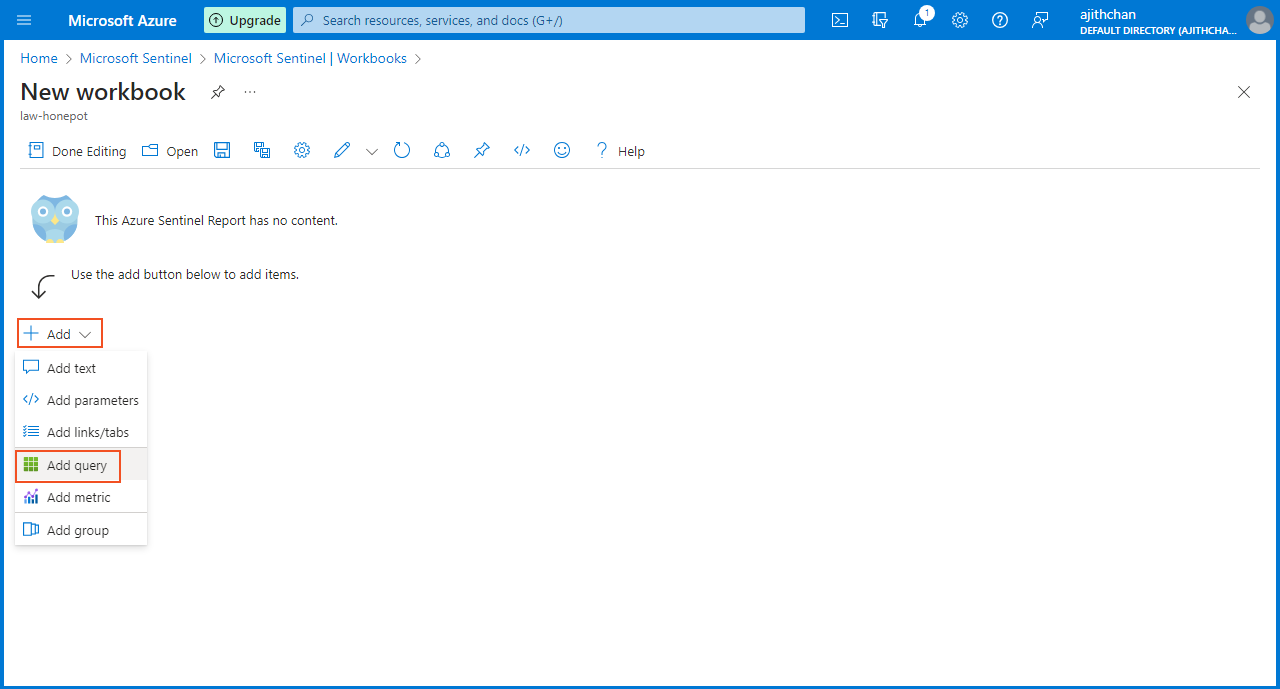
On the "Workbooks" section I created a new workbook using the "Add Workbook" option. Then I proceeded to click on "Edit" and removed the default widgets that were already present. Following that, I selected "Add query" to specify the dataset and fields from Log Analytics that I wanted Microsoft Sentinel to utilize. This allowed me to effectively query the desired data within the workbook.
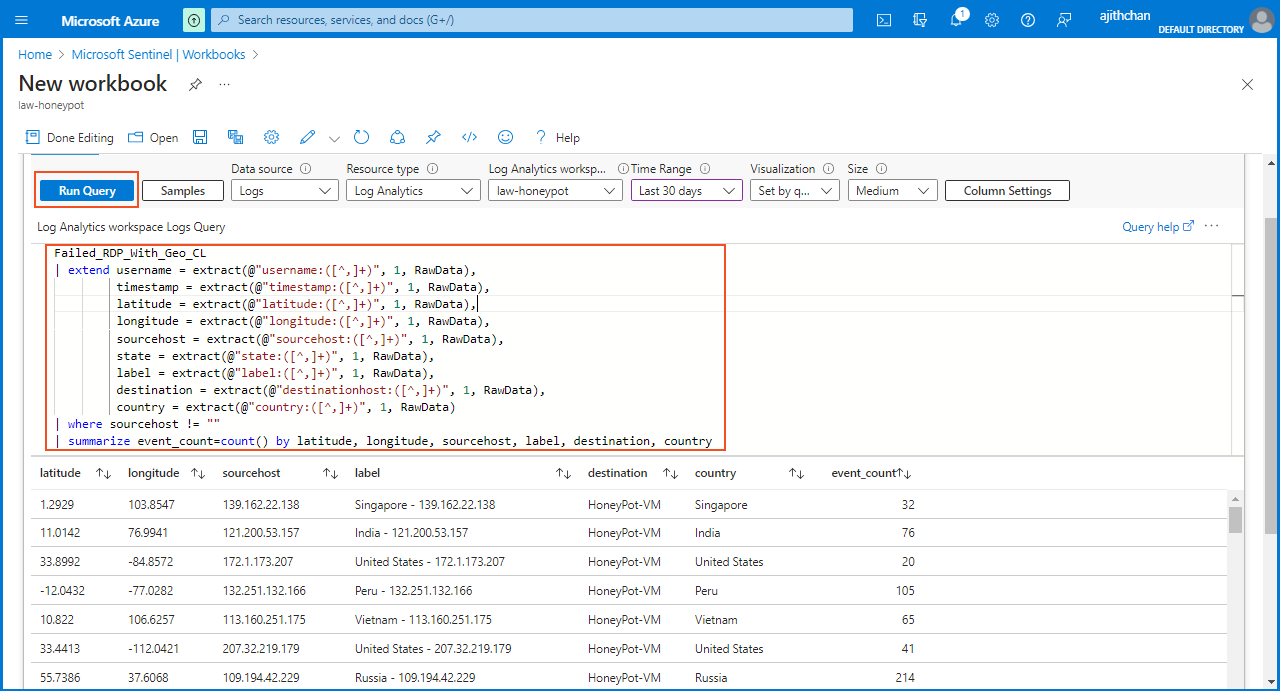
Afterward, I entered the query provided below and selected the "Run Query" option, which retrieved all the necessary information for plotting the "Failed RDP World Map."
Failed_RDP_With_Geo_CL
| extend username = extract(@"username:([^,]+)", 1, RawData),
         timestamp = extract(@"timestamp:([^,]+)", 1, RawData),
         latitude = extract(@"latitude:([^,]+)", 1, RawData),
         longitude = extract(@"longitude:([^,]+)", 1, RawData),
         sourcehost = extract(@"sourcehost:([^,]+)", 1, RawData),
         state = extract(@"state:([^,]+)", 1, RawData),
         label = extract(@"label:([^,]+)", 1, RawData),
         destination = extract(@"destinationhost:([^,]+)", 1, RawData),
         country = extract(@"country:([^,]+)", 1, RawData)
| where sourcehost != ""
| summarize event_count=count() by latitude, longitude, sourcehost, label, destination, country
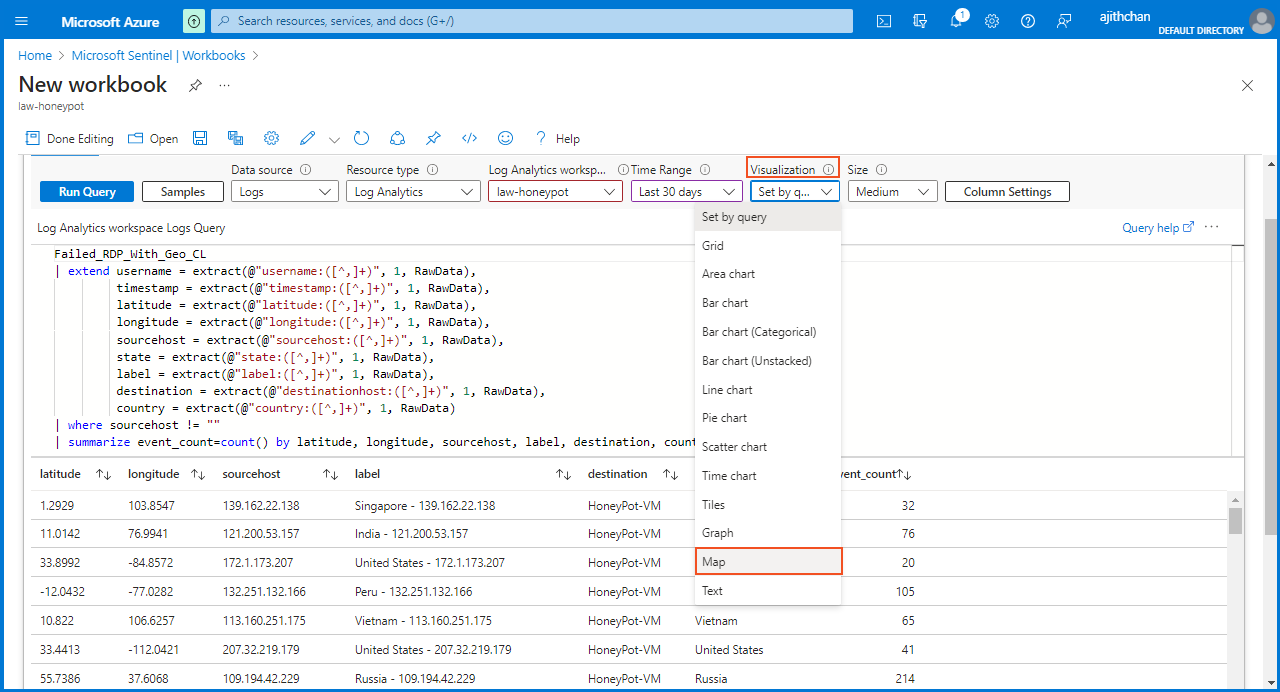
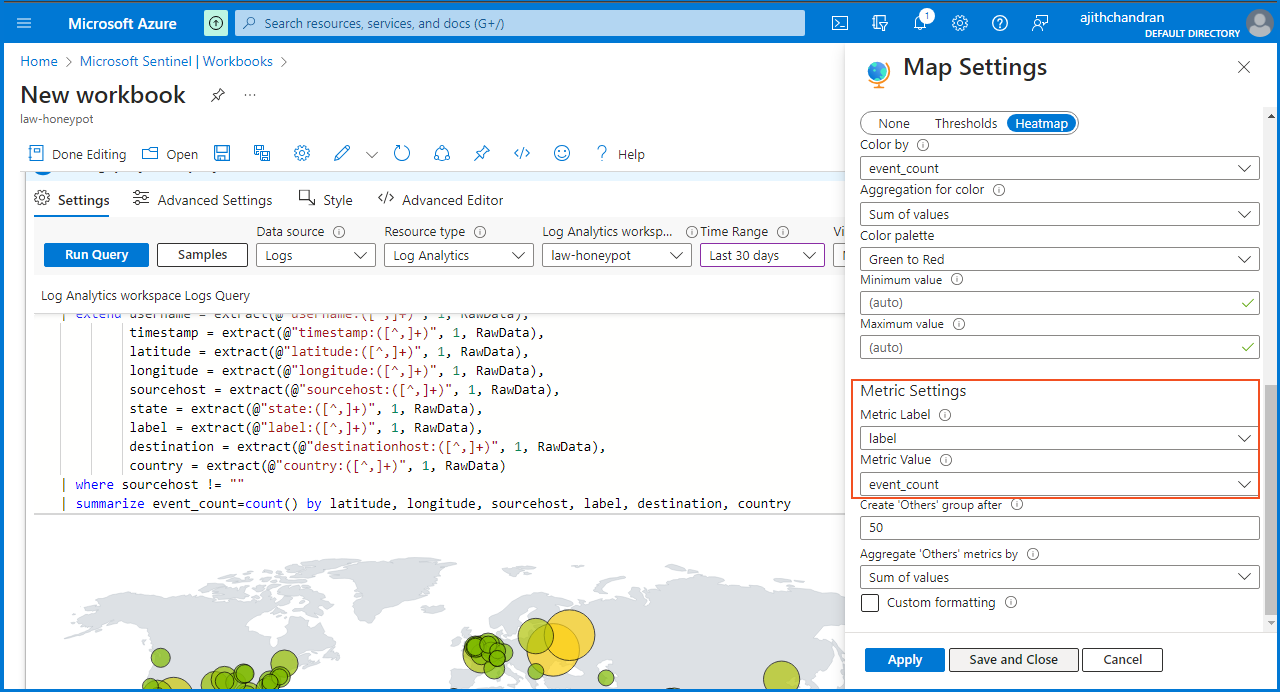
I clicked on "Visualization" and selected "Map" from the drop-down menu. Moving on to the "Map Settings" section, I scrolled down to the "Metric Settings" where I chose "label" for the "Metric label" and "event_count"for the "Metric Value."
Once done, I clicked on "apply" and then on "Save and Close." Finally, I saved the workbook under the name "Failed RDP World Map."
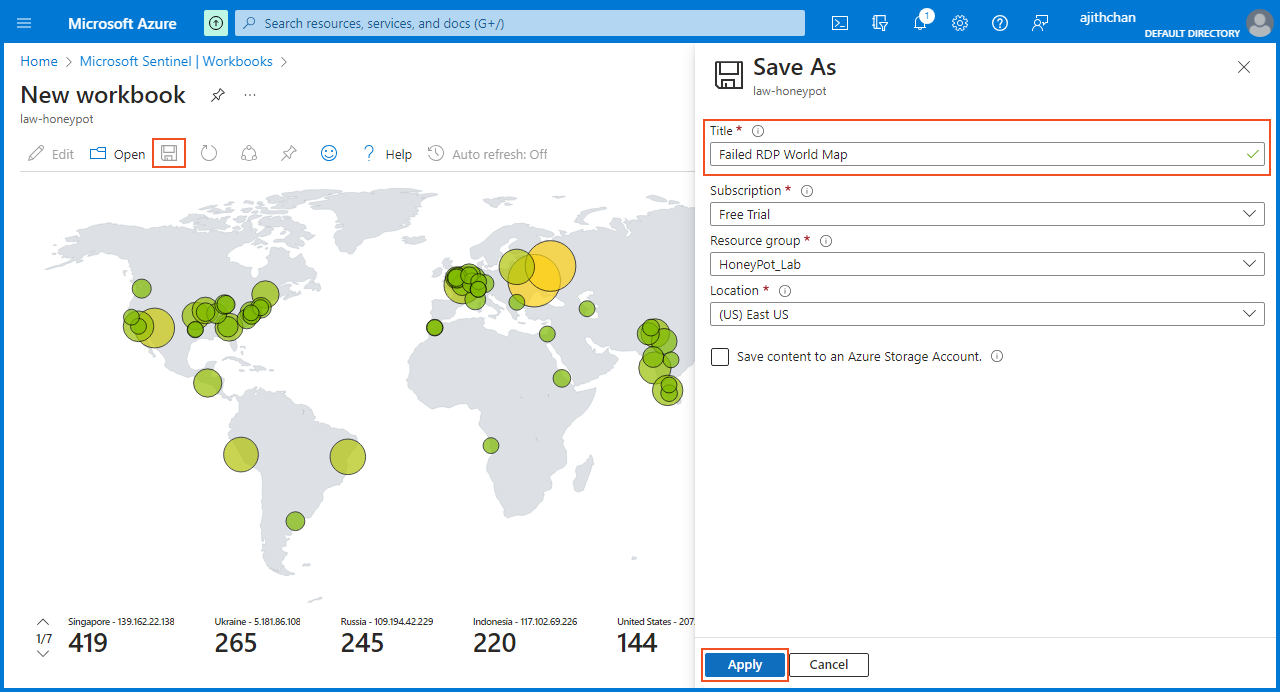
Visualized data on the map.
During the "Home Lab for Live Attack Demonstrations in SIEM (Microsoft Sentinel)" project, I gained practical experience in several crucial areas. This encompassed creating a virtual machine (VM) in Azure, configuring log collection using Log Analytics Workspace, working with APIs, and utilizing Azure Sentinel for SIEM purposes. I effectively utilized a PowerShell script to extract failed logon attempts, retrieve geolocation data, and visualize it on a map.
Participating in this hands-on project was an enjoyable and immensely educational experience. This practical engagement greatly enhanced my skill set and provided me with a deeper understanding of the capabilities of Microsoft Sentinel and its pivotal role in bolstering cybersecurity measures.
. . .